

Following a law passed last year, Minnesota Management and Budget (MMB), in conjunction with the Department of Revenue, has created a Taxpayer Receipt, an interactive tool where Minnesotans can see where their taxes go. In addition to showing how tax revenues are shared among public services, the tool also links spending to outcomes.
Admittedly, these are worthy goals.
Taxpayers spend a significant portion of their paychecks to fund public services. They deserve to know where that money is going and if it is accomplishing the necessary results. Unfortunately, on both of these goals, the receipt offers limited insight.
For one, MMB already provides data on spending by agency and service. The taxpayer receipt uses the same format, offering no new information, especially since it does not go beyond the headline numbers.
Additionally, since spending data is general, it has a limited connection to outcomes. In some programs, outcomes also include things like spending levels or future targets, so there is no clear picture of how spending and results compare.
Spending data needs to drill down further
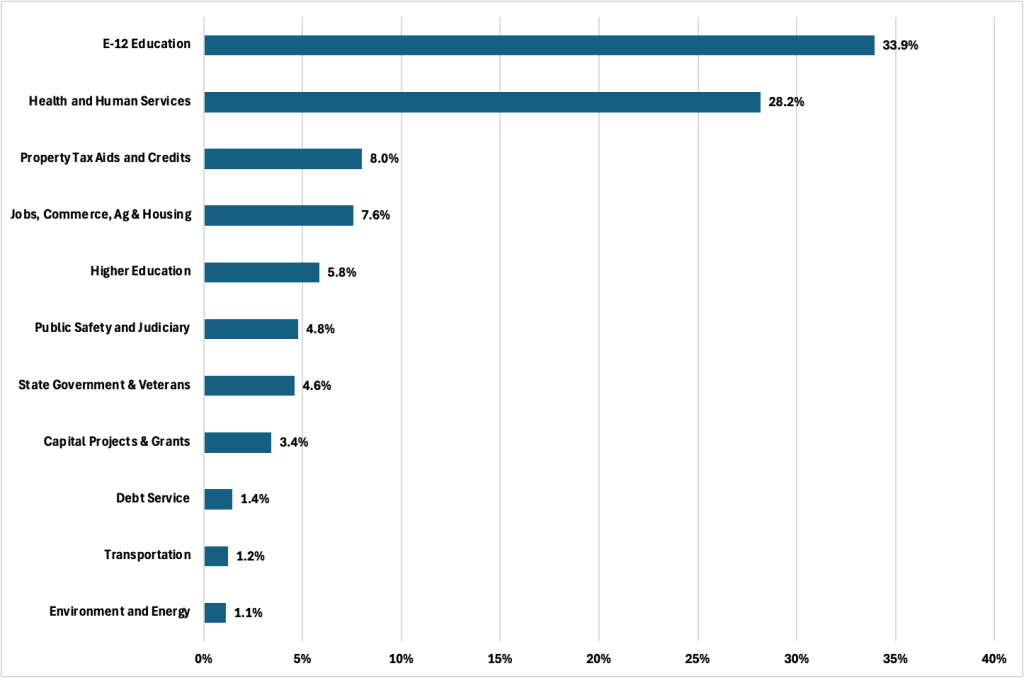
Every February, July, and November, MMB publishes budget forecasts detailing state spending. Looking at the 2025 End-of-session estimates, E-12 education is the largest state expenditure, followed by Health and Human Services (HHS), which includes spending on assistance programs, such as Medicaid, childcare, and welfare checks.
Figure 1: General Fund Spending by Category, FY 2024
The receipt provides the same data, leaving many questions unanswered.
For instance, E-12 education accounts for a third of the state budget. How much of that money is spent on classroom instruction? Spending on Higher education constitutes nearly 6 percent of the budget. How much of that is spent directly on financial aid to students, as opposed to funding a bloated Administration?
Data on outcomes is lacking
Do Minnesotans on public health insurance have better health outcomes than they would otherwise or compared to other states? Does spending on affordable housing lower housing prices? Are state roads and bridges in good condition? Does financial aid increase college completion among students who might not attend due to cost?
These are questions you won’t get answers to through the receipt, mainly since the data is not provided.
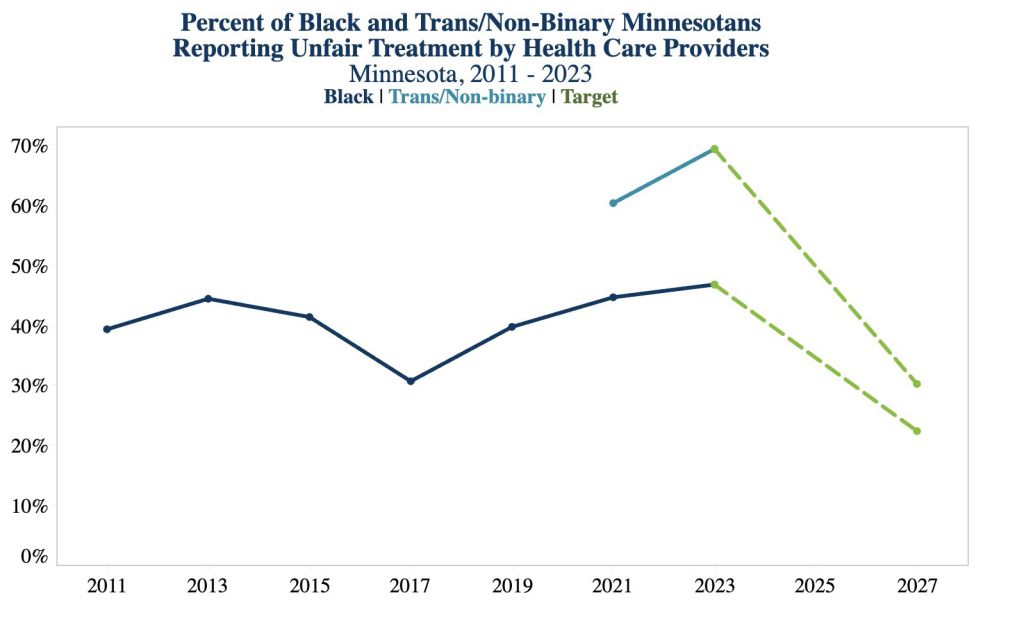
Health outcomes, for example, measure the percentage of black and Trans/Non-Binary Minnesotans who report unfair treatment by healthcare providers. Medicaid, however, covers a wide range of Minnesotans. That includes pregnant women, children, adults without children, seniors, and people with disabilities. Most of these groups don’t show up in this metric. And the metric doesn’t tell us anything about the quality of Minnesota’s Medicaid program.
Similarly, outcomes for long-term care services include how many people are served, how much the programs cost, but not whether these programs serve people well.
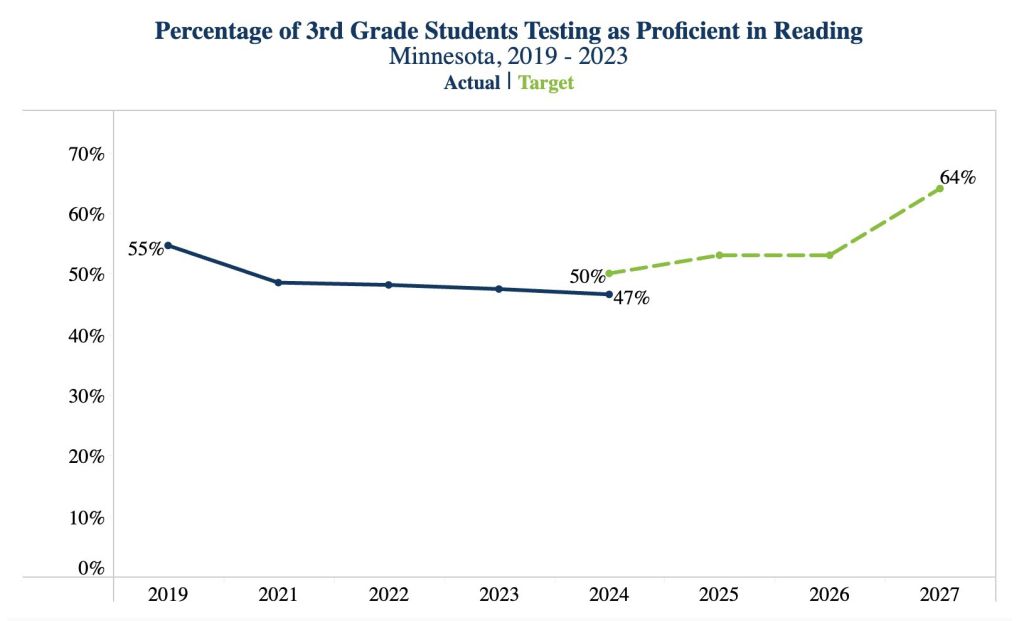
Certainly, easily measurable outcomes, such as crime rates, reading proficiency, are available. However, they do not link to specific spending numbers, merely headlines spending numbers. Where outcomes are worsening, the receipt supplements them with improved future targets or expected outcomes.
A worthy goal
Minnesotans deserve to know where their tax money goes and whether spending is accomplishing stated goals. For that, more data is needed.
Spending needs to be broken down further, and outcomes should remove future targets and emphasize the quality of services and not the number of people served. Comparisons with other states could also give Minnesotans a clear picture of whether their state’s high-tax,high-spending model offers superior results.


