Last week, I noted that “[i]n every single year since 2014, Minnesota’s economy has grown more slowly, in real terms, than that of the United States. What accounts for this? As I also noted, “[t]he growth rate of total [Gross Domestic Product] GDP is simply the sum of the growth rate of the population and the growth rate of per capita GDP.” So, we can begin to investigate our state’s relatively poor record on GDP growth by breaking it down into the growth of its two components.
GDP per capita growth
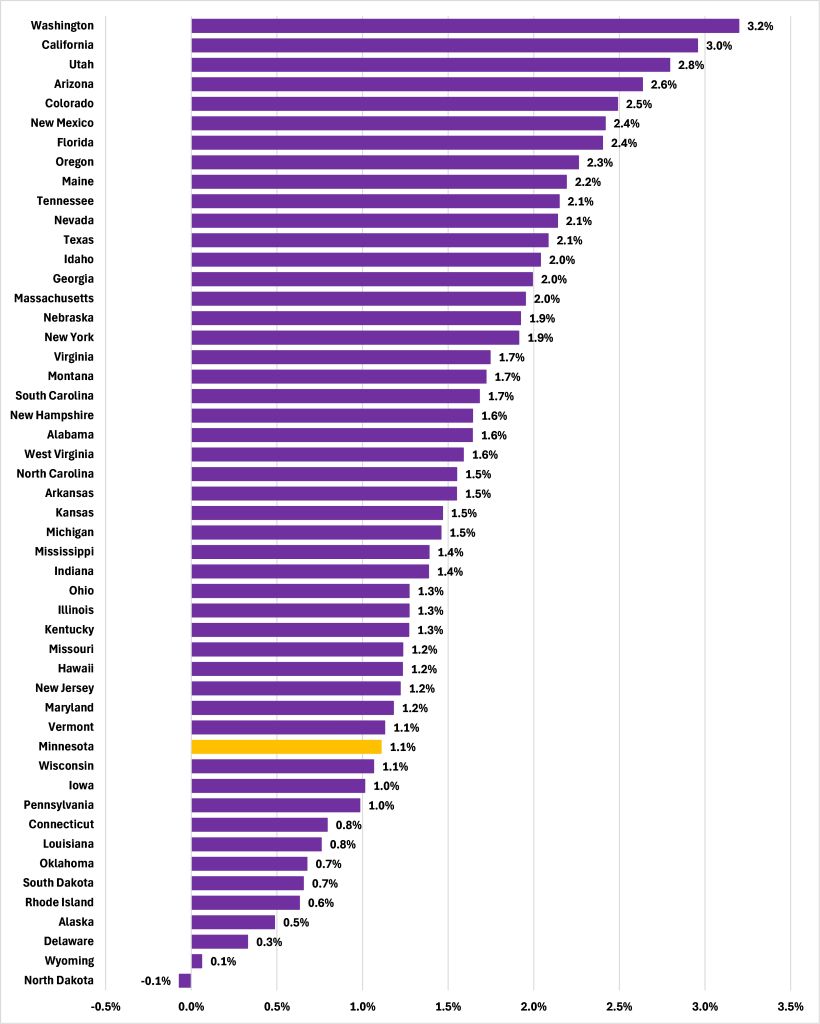
Figure 1 shows the average annual growth rate of per capita GDP for the years 2014-2015 to 2023-2024. Since 2014, per capita GDP in Minnesota has grown at an average rate of 1.1% annually, a performance worse than in 37 out of 50 states.
Figure 1: Average annual per capita GDP growth rate, 2014-2015 to 2023-2024
This is a grave concern. As we noted in our 2021 report “The State of Minnesota’s
Economy: 2020: A focus on economic growth,”
What matters for economic welfare is per capita income. This is a general measure of welfare, telling us how much per person is available to be consumed, invested, or put to some other use.
If we want to increase economic welfare, we should pursue policies that increase per capita incomes.
Accounting for growth
We examined this phenomena in depth in our recent report “Accounting for Growth:
Measuring the sources of per capita economic growth at the state level.” Using a technique known as “growth accouting,” we broke down the growth rate of per capita GDP into its components; the per capita growth rate in human capital, physical capital, and Total Factor Productivity.
We found that Minnesota’s average annual rate rate of per capita human capital growth between 2014 and 2023 ranked 42nd out of 50 states. This was driven by low rankings for the growth of the employment/population ratio (43rd out of 50 states), and the per worker skills arising from education (42nd) and experience (45th).
We also found that Minnesota’s average annual rate of per capita physical capital growth ranked 37th out of 50 states after 2014, and that this was driven by the poor performance of our state’s manufacturing sector.
Minnesota’s relative economic slowdown is, then, broad based, with sources in both the labor market and manufacturing sector.