
Back in October, I wrote about Minnesota’s relatively poor performance on Gross Domestic Product (GDP) per capita growth in the last decade.
To investigate this, I wanted to do what economists call a “growth accounting” exercise for Minnesota, which breaks down the growth rate of per capita GDP into the portions arising from increases in human capital, the quantity and quality of the labor provided; growth in physical capital, the tools those workers have to use; and growth in Total Factor Productivity, which is the efficiency with which these factors are combined.
This, in turn, required the construction of estimates of human and physical capital for Minnesota. I built these estimates and laid out the method in my report “Accounting for Growth: Measuring the sources of per capita economic growth at the state level” and the results are available as the American Experiment United States Tables, now updated to include 2024.
Human capital per worker, 2024
My updated estimates for physical capital per worker for 2024 were released in October. My estimates of human capital per worker for 2024 are shown in Figure 1. We see that Tennessee, surprisingly, perhaps, ranks top with North Dakota second. New Mexico brings up the rear and Minnesota ranks 15th out of 50 states.
Figure 1: Human capital per worker, 2024
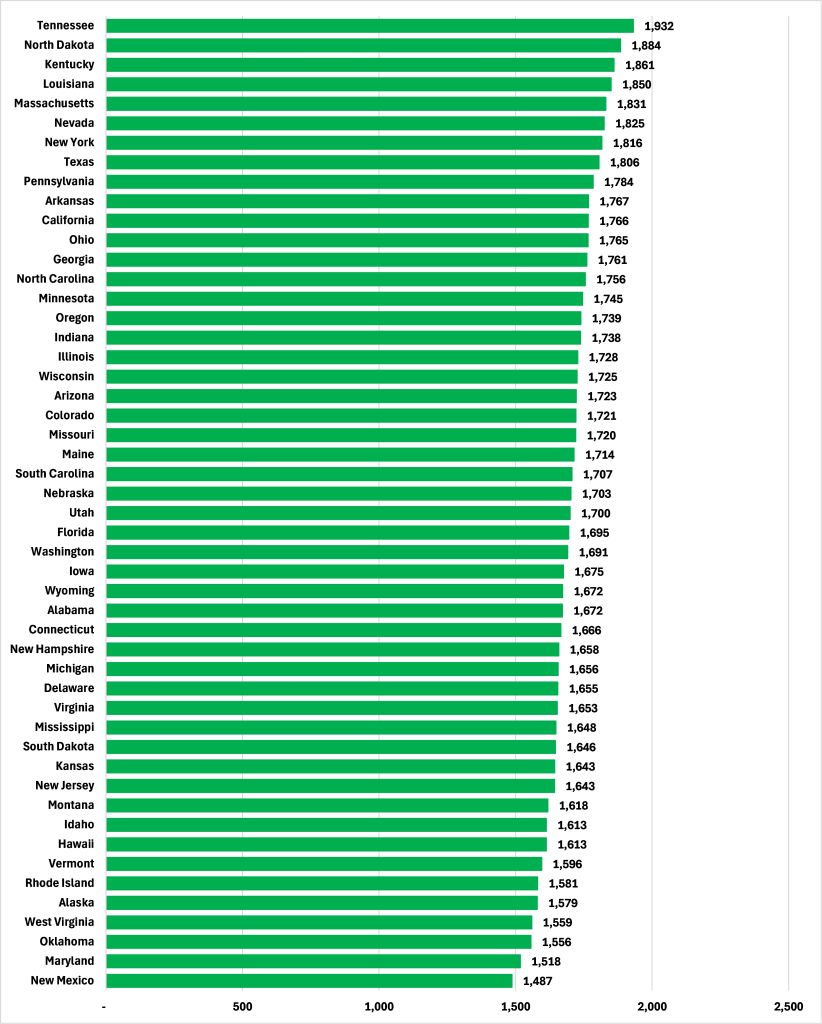
Over the ten years from 2015 to 2024, Arkansas saw the best improvement in its ranking, rocketing from 40th to 10th. Delaware, by contrast, slipped 15 places from 20th in 2015 to 35th in 2024. Minnesota’s 15th spot in 2024 was down five places from 2015, and North Dakota slipped from first to second.
Growth in human capital per worker
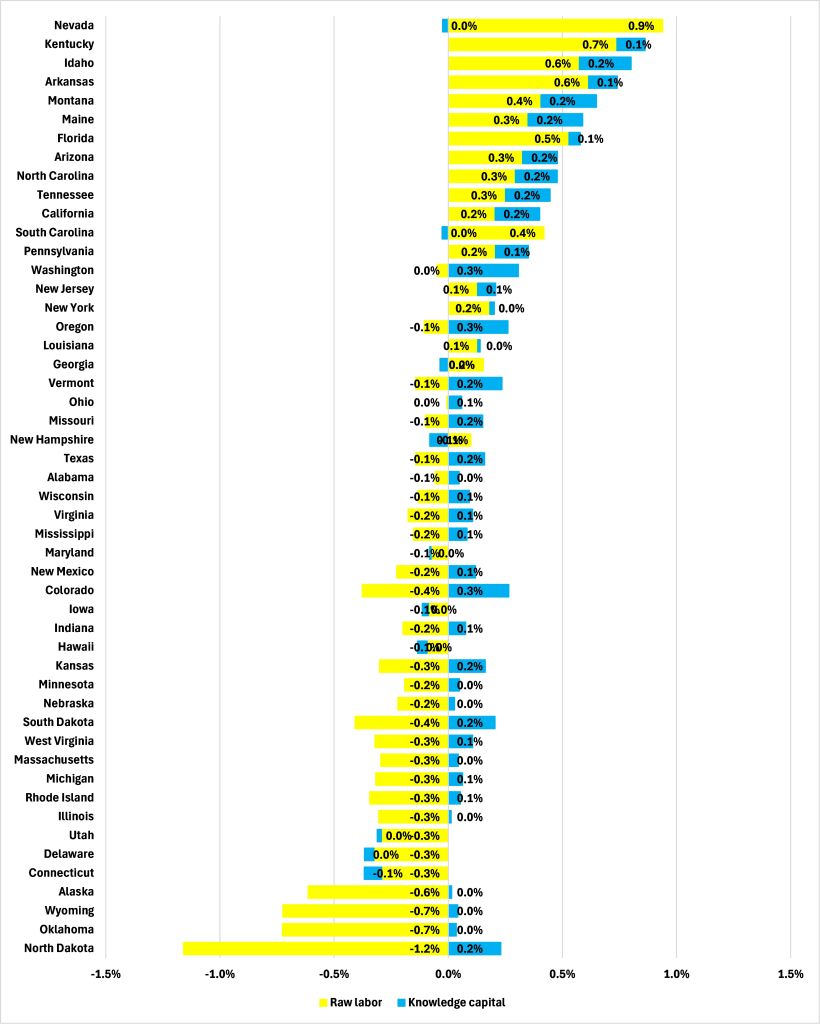
Our estimates for human capital derive from four things which can be grouped as either “raw labor” — employment and average hours worked annually — and “knowledge capital — the skills each worker possesses arising from education or experience. We can break down the average annual growth rate of human capital per worker over the last decade — from 2014-2015 to 2023-2024 — into the shares arising from increases in either raw labor — working harder — or knowledge capital — working smarter.
Figure 2 shows the results of this exercise. While Nevada saw the fastest average annual rate of per worker human capital growth over the last decade at 0.9%, all of that came from increases in raw labor in the form of each worker working longer hours, on average. In North Dakota, by contrast, where the per worker human capital stock declined by an average rate of 0.9% annually, the “worst” performance in the country, all of this was the result of a decline of average hours worked of 1.2% annually while each worker’s stock of knowledge capital increased by 0.2% annually (-1.2 – 0.2 = -0.9 with rounding). If we assume that working smart is preferable to working hard — not least because there are limits to the growth that can be derived from increasing the number of hours worked — then last place North Dakota actually performed than first place Nevada.
Figure 2: Average annual increase of human capital per worker, 2014-2015 to 2023-2024
Which states are doing best when it comes to working smarter — increased per worker knowkedge capital? Figure 3 shows us and is simply Figure 2 with the raw labor component removed. Nevada now ranks 8th from the bottom and North Dakota jumps to 7th out of 50 states. Minnesota ranks 31st.
Figure 3: Average annual increase of knowledge capital per worker, 2014-2015 to 2023-2024
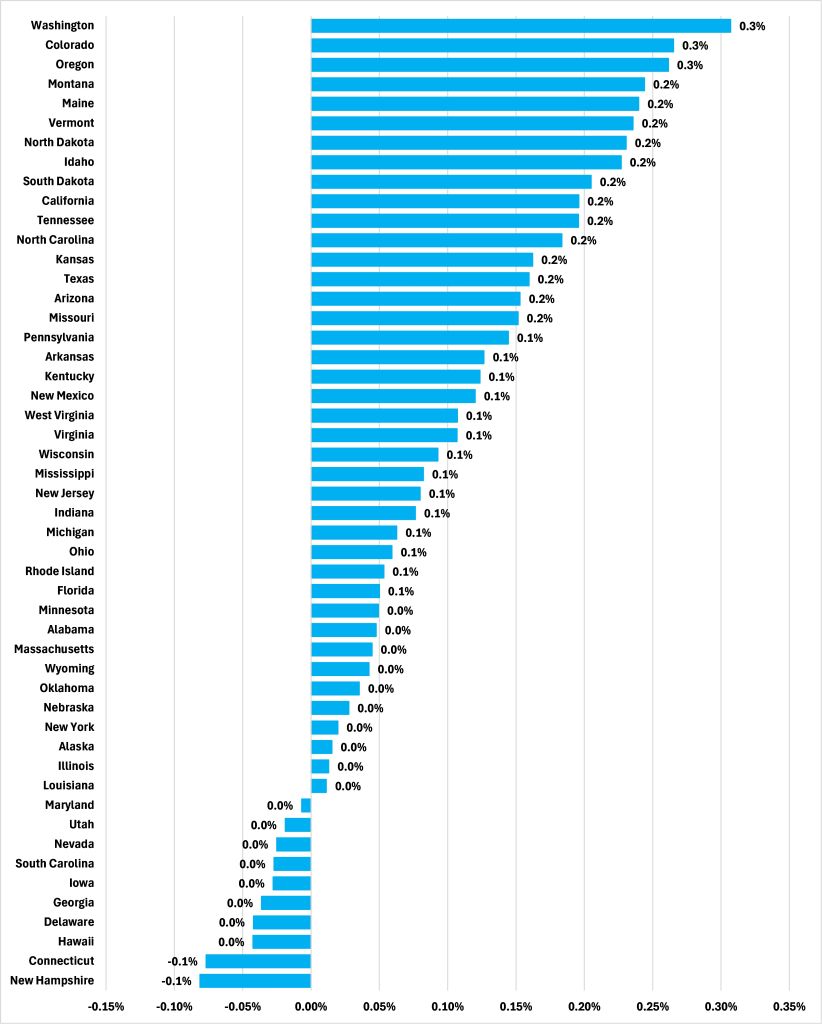
Knowledge capital — the average skills each worker possesses arising from education or experience — is not subject to the same limits as hours worked. If states are to drive faster per capita GDP growth from faster rates of per worker human capital growth, in the long run it is here that they must look to do so.