One way to assess Minnesota’s high school educational prowess is to look at ACT scores throughout the years.
Originally a primarily Midwestern alternative to the SAT, the ACT is a college admittance exam administered today to millions of high schoolers. Students typically take the test in their junior year. It has four subsections: mathematics, reading, science, and English, and an optional writing exam. While the ACT was originally created in 1959, major structure shifts in 1989 produced the form of today’s exam. The ACT shifted dramatically in fall 2025, shortening the test and making the science section optional.
Perhaps partially due to the test’s Midwestern roots, the students of Minnesota have taken the ACT in steadily high numbers. From 1993- 2002, ACT participation rate among Minnesota high school graduates varied from 59 percent participation to 66 percent. Participation remained in the 50 – 75 percent range until reaching 62 percent in 2013 (Minnesota’s highest scoring year). In 2014, the test had a 76 percent participation rate, and participation rose still further (100 percent in 2016 and 2017, 99 percent in 2018, 95 percent in 2019, and 92 percent in 2020) before dropping significantly. With the drop initially attributable to district COVID-19 limitations, participation rates have plummeted to 60 percent in 2021, 69 percent in 2022, 68 percent in 2023, and 66 percent in 2024, and 68 percent in 2025.
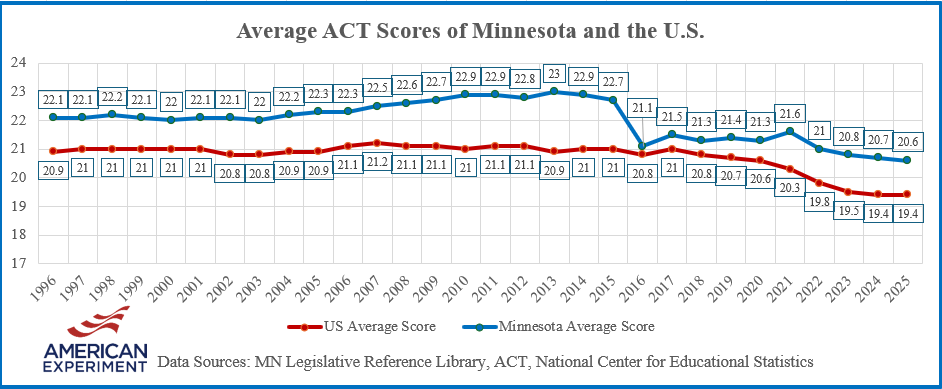
As can be seen above, the average Minnesota ACT score remained comfortably above the national average until dropping in 2016 to a mere .3 points above the average. Those curious about the drop should be reminded that in 2013, the DFL-controlled legislature removed the Graduation Required Assessment for Diploma (GRAD), which required specific reading and math scores in order to receive a high school diploma. At the time, lawmakers then mandated that all juniors take the ACT, and set aside funds for that purpose. After just one year, lawmakers stopped funding the mandate. Due to the mandate, the class of 2016 saw Minnesota’s first 100 percent ACT participation rate. Districts and families continued to prioritize the ACT, with continuously high participation rates and strong national rankings as a result.
Yet, even though COVID should have only strongly impacted the average ACT participation rates of the classes of 2021 and 2022, participation rates have dropped back down to the high 60 percent range. Some of these students are surely opting to place test-optional college applications, (a question for another post) but it’s also possible that students are choosing not to apply for college at all. Of those students who are opting to take the test, post-COVID scores are the lowest Minnesota has seen in 20 years. If these test takers are self-selecting for collegiate applications, how are the lower performers doing?
Minnesota once had a formidable presence on the national education scene. If policymakers, district leaders, and families pay attention to the state’s slipping test scores, it is possible that strong reform can bring renewal.
One way to understand how an ACT score shows college readiness is to examine ACT’s college readiness benchmarks. For an excellent analysis on Minnesota’s recent showing on the college readiness benchmarks, please refer to my colleague Catrin Wigfall’s piece.