Introduction and Key Findings
In 1992, Coloradans passed Amendment 1 to enshrine Article X, Section 20, known as the Taxpayer’s Bill of Rights (TABOR), in the state constitution.[1] The preferred interpretation of the measure, as stated in the ballot language, was to “reasonably restrain most the growth of government.”
To reasonably constrain government growth, TABOR requires that tax increases be subject to voter approval and that state and local revenue and spending increase only at the rate of inflation plus population growth, unless authorized by voters.[2]
A cursory review of budget data and political rhetoric suggests that TABOR has successfully limited state government growth.[3] However, Independence Institute research indicates that Colorado’s state government has expanded more rapidly than expected and likely more than would be considered “reasonable” under TABOR. Here are several highlights from the report.
- Historical budget data, adjusted for inflation and population, indicate that the state government has increasingly circumvented the intent of TABOR.
- Changes in budget composition over time have led to increased TABOR-exempt funds.
- Government spending continues to grow faster than Colorado’s GDP.
- The rate of growth in state government employment continues to outpace that of private-sector jobs.
- Professional lobbyist income continues to grow in line with increasing government intervention in the economy.
- Medicaid enrollment continues to increase dependence on government spending.
- Effective state and local tax rates have risen over time.
Although TABOR may constrain state government growth to some extent, it has not done so in the way widely believed, as it is systematically and deliberately circumvented.
This report focuses on state government growth but also addresses local government growth when relevant. The appendix explains the methodology and analytical standards used to collect the data presented in the report.
Growth of Government as Reflected in the Budget
One of the key components of the Taxpayer’s Bill of Rights (TABOR) is that government spending may not grow faster than the rate of inflation plus the rate of population change each year unless authorized by voters. According to TABOR, this constitutes reasonable annual growth. The reasoning behind such a limit is logical.
First, inflation affects individuals and governments alike and is primarily determined by the U.S. Federal Reserve. Therefore, inflation occurs independently of state government action. Consequently, as inflation increases, the cost of government services rises as well, and the state government is permitted to grow in line with inflation.
Second, as the state’s population increases, more people will be expected to use the same government services, necessitating government expansion to maintain the status quo level of service; conversely, a population decline would also require government contraction to maintain that level of service.
Historical Budget Data
State budget numbers alone are insufficient to accurately assess the growth of Colorado’s state government. Bottom-line budget numbers exclude the necessary context of inflation and population growth. Therefore, the budget must be adjusted for inflation and population change. Doing so makes the growth in inflation-adjusted per capita revenue and spending clear, as shown in Figure 1.
Figure 1
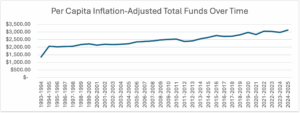
Based on TABOR’s assumptions, the rate of change of the funds shown in Figure 1 is expected to be close to 0 percent, because, apart from voter-approved revenue changes, TABOR should limit essentially all other growth. However, this initial expectation overlooks the fact that Colorado’s voters occasionally approve tax increases and that Colorado’s budget is generally categorized into three categories:
- General Funds: the portion of the budget that the Joint Budget Committee must balance each fiscal year. Most of these funds are subject to TABOR.
- Cash Funds: funds earmarked for specific purposes and generally TABOR-exempt. Most cash funds receive revenue from fees collected by state enterprises.[*]
- Federal Funds: funds from the federal government that are typically earmarked for specific purposes and are TABOR-exempt.[4]
Because two of the three components of the state’s budget are TABOR-exempt, the overall rate of change for the state’s total funds per capita is unsurprisingly greater than 0 percent. The state’s total funds per capita increased by $1,770.61 from Fiscal Year (FY) 1993-1994 to FY2024-2025, representing a 96 percent increase.
Budget Composition
Inflation-adjusted per capita funds must be examined across the three budget components to provide a more comprehensive picture of how the state government circumvents TABOR. As shown in Figure 2, the General Fund’s total rate of change between FY1993-1994 and FY2024-2025 was 44 percent, a reasonable increase over three decades given voter-approved changes. By comparison, the total rate of change for cash funds during the same period was 588 percent, and for Federal funds it was 278 percent.
Figure 2
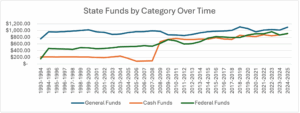
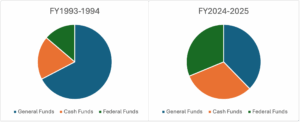
The substantial increase in cash funds relative to general funds was not accidental. The state government consistently and deliberately created enterprises to generate fee revenue exempt from TABOR. As illustrated in Figure 3, the General Fund accounted for 56 percent of the total budget in FY1993-1994 but decreased to 35 percent by FY2024-2025. Meanwhile, cash funds increased from 16 percent to 29 percent, and federal funds from 12 percent to 29 percent during the same period.
Figure 3
TABOR’s critics often argue that it imposes unnecessary austerity on the state budget.[5] The state’s Appropriation Reports clearly refute these claims.[6] TABOR has been consistently circumvented, as evidenced by significant increases in per capita cash fund revenue and a declining share of total funds subject to TABOR. This is not an inherent distortion of TABOR but rather a deliberate legislative effort to circumvent the state’s constitutional restraints.
While historical budget data help demonstrate the growth of Colorado’s state government, several other metrics can further clarify the extent of that growth relative to TABOR, Colorado’s economy, and population.
Other Metrics of Growth
The following data present further evidence of Colorado’s government growth. While the list is not exhaustive, it provides a more well-rounded understanding of how the state government has grown relative to other economic factors and of the implications of that growth.[†]
Spending relative to GDP
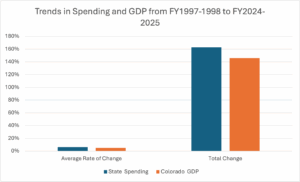
According to Federal Reserve Bank of St. Louis (FRED) data, Colorado’s Gross Domestic Product (GDP) has grown at an average annual rate of 5 percent since 1997, for a total increase of 146 percent.[7] Meanwhile, Colorado’s state spending has increased at an average annual rate of 6 percent, resulting in a 163 percent increase over the same period.[8] Figure 4 shows how Colorado’s spending and GDP have changed over time.
Figure 4
A state or country’s GDP is calculated by summing up consumption, investment, government spending, and exports, then subtracting imports.[9] Notably, Colorado’s government spending as a share of GDP has increased since the Great Financial Crisis, rising from 7 percent to 8 percent annually. Although it is difficult to measure the effects of increased public spending relative to GDP, a higher share of government spending relative to GDP could eventually lead to less efficient allocation of resources to less productive uses than private spending.[10],[11]
Perhaps federal spending is more illustrative of concerns about excessive government spending, as in 2024, the federal government spent more on interest on the national debt than on the military or Medicare.[12] While Colorado’s spending is not yet as exorbitant as the federal government’s, the trajectory warrants attention, especially as TABOR is increasingly bypassed.
Public versus private employment
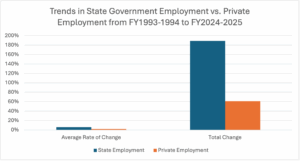
According to FRED data and Colorado’s Appropriation reports, state government employment has grown at a higher average annual rate than private employment.[13],[14] From 1993 to 2024, Colorado’s total private employment increased at an average annual rate of 2 percent. Meanwhile, state employment increased by an average of 6 percent per year. Figure 5 shows these employment trends over time.
Figure 5
Professional Lobbyist Income
Individuals, businesses, and organizations pay professional lobbyists to influence policymaking on their behalf. As Figure 6 shows, professional lobbyist income has increased by 374 percent, adjusted for per capita income and inflation, since FY1995-1996.
Figure 6
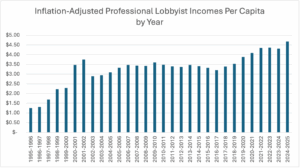
Professional lobbyists earning more over time is not inherently problematic. Some of this growth can be attributed to real wage growth for lobbyists. However, it is unlikely that wage growth accounts for all, or even most, of the income growth, as real household incomes increased by only 37 percent over the same period.[15] Hence, this significant increase in inflation-adjusted per capita lobbyist income is a symptom of increasing government intervention in the state’s economy. While some may argue that the increase in lobbyist incomes reflects more complex policy, this complexity is largely driven by the layering of rules and regulations by an interventionist government.
In a free market, businesses that earn profits are more likely to raise wages, increase shareholder dividends, and reinvest in new equipment, research and development, marketing, and other areas to improve efficiency and profitability. However, in an economy in which the government plays a controlling role in selecting winners and losers, companies may, in turn, allocate more of their profits to influence policymakers rather than to productive investment.[16]
Medicaid Enrollment
Healthcare spending is now the state’s leading driver of budget growth and government expansion. Healthcare accounts for nearly 40 percent of total funds and 33 percent of the General Fund.[17] Additionally, costs are expected to rise because Colorado’s population is among the fastest-aging in the country and is growing more slowly, leaving fewer people to fund services for an increasingly vulnerable population.[18]
Although annual Medicaid enrollment data are difficult to obtain, previous research by Independence Institute found that enrollment rose from approximately 500,000 in FY2009-2010 to 1.3 million in FY2017-2018.[19] In 2025, average monthly enrollment was 1.2 million.[20]
The purpose of government welfare, on paper, is to help people who cannot help themselves and to increase independence among those who can. However, enrollment in Colorado’s Medicaid program has increased, suggesting that more people are becoming reliant on government services rather than fewer, and at a rate faster than the state’s population is growing. In 2009, 500,000 people were enrolled in Medicaid, representing 10 percent of Colorado’s population. In 2025, 1.2 million people were enrolled, representing 23 percent of the state’s population. Meanwhile, Colorado’s poverty rate is only 8.2 percent of the state’s population as of 2025.[21]
Effective Taxation
Due to legislative distortions in Colorado’s tax code, the tax rate can differ between the explicit law and the percentage of a person’s income that they actually pay toward the tax. This is the difference between the nominal tax rate and the effective tax rate.[22] For example, Colorado’s nominal state income tax rate is a flat 4.4 percent. However, the effective tax rate for the state’s flat income tax varies with tax credits and deductions, which affect the amount one may actually owe to the state. According to Colorado’s Department of Revenue, the average effective tax rate for the state income tax was 3.1 percent in 2020, but it varied across income levels.[23]
Therefore, the effective tax rate is the percentage of income Coloradans actually pay to the state. In 2001, Coloradans’ combined average effective tax rate on all state taxes owed (income, sales and use, gasoline, alcohol, etc.) was 3.69 percent.[24] Including the local combined effective tax rate (property, sales and use, etc.), the number was 6.57 percent, meaning that, on average, Coloradans paid 6.57 percent of their income to state and local governments. By 2020, those percentages had reached 4.2 percent and 8.3 percent, respectively.
Theoretically, as the state’s population increases, the state government could incrementally lower tax rates so that each Coloradan owes less in taxes while remaining revenue-neutral.[25] This is the basis of broad-based taxation. From 2001 to 2020, the state’s population increased, so it could have reduced tax rates while maintaining the TABOR-required level of funding. Instead, average effective tax rates increased, showing that Colorado taxpayers pay a higher percentage of their income in taxes despite a larger population that could support the same level of revenue when adjusted for inflation and population.
Conclusion
The Taxpayer’s Bill of Rights is less controversial than debates in the state house might suggest.[26] Despite claims that the constitutional amendment is the primary cause of challenges in infrastructure, health, and education, TABOR remains popular. Coloradans value having direct involvement in tax policy. However, as TABOR is increasingly circumvented, people have less representation in taxation and government spending. Across all metrics examined, the government continues to grow faster than inflation and/or population growth. More state funds are TABOR-exempt than at any time since the amendment was passed in 1992. Meanwhile, Colorado is becoming less competitive and less appealing compared to other states.[27],[28] By examining different metrics adjusted for inflation and population, this report shows how the state government continues to grow beyond what was intended by TABOR.
Areas for Future Research
As stated earlier, the metrics presented in this report provide a non-exhaustive overview of Colorado’s state government’s growth. However, the state government is only one level of government that represents Coloradans, and even if its growth were measured in its entirety, it would not provide a complete picture of growth across all levels of government and its effects on Coloradans’ lives.
More state-level research on government growth could focus on several topics, including contracted employment growth, changes in enrollment over time in other state programs, local government employment growth relative to local private-sector employment growth, the historical expansion of regulation, public-sector compensation, and PERA liability trends.
Rather than focusing solely on state-level government growth, similar research on local-level government growth would be time- and resource-intensive. Still, it would be invaluable for providing a more accurate understanding of government growth, TABOR, and historical trends. As of 2023, 51 of Colorado’s 64 counties, 230 of 274 municipalities, and 177 of 178 school districts had opted out of TABOR’s spending limits by voter referenda.[29] Therefore, research could examine the relationships between per-pupil funding and school property tax revenue with respect to grades and test scores. Based on the findings in this report, school district revenues may be increasing faster than pupil populations, even after inflation adjustment, yet grades and test scores are stagnant or declining in several districts. Such research would be worth pursuing to improve K-12 education in the state.
Appendix
1993 as the base year
This report assumes that, where relevant, dollar figures should be adjusted for inflation and population in a given year to more accurately reflect changes over time in the money-based metrics presented. Several historical datasets cover varying time spans. Because this report focuses on TABOR, which took effect at the end of 1992, the initial year for most datasets is 1993, when available; otherwise, the earliest available year is used for datasets that do not include records as early as 1993. The state government’s fiscal year begins on July 1st. Therefore, monthly data that do not align directly with the state’s fiscal years are set to the July figure. For example, in Colorado’s GDP data from FRED, the July figure is used for the entire year 1993, so that the state’s FY1993-1994 corresponds to July 1993 in the monthly data.
Inflation
When adjusting for inflation, this report uses the Denver-Aurora-Lakewood Consumer Price Index (CPI) and sets the base year to the first year of the relevant dataset (typically 1993, when data are available; see above).[30]
Per Capita
After adjusting for inflation, this report divides financial data for a given year by the resident population in Colorado for that year, as reported by FRED.[31] Other non-financial data may also be disaggregated using annual population data and similar methods, such as the number of Coloradans enrolled in Medicaid as a percent of the state population.
Budget Data
Budget-related data were collected directly from the General Assembly’s Annual Appropriation Reports.[32] Because annual aggregate budget data are updated in subsequent Appropriation reports (primarily due to supplemental bills and actual revenue revisions), this report uses the financial data from the most recent year for which figures were published. For example, for FY1993-1994 (the base year used for most data in this report), the 1993-1994 Appropriations Report assumes Total Expenditures of $8,001,003,445. However, by the FY1996-1997 Appropriations Report (the last time FY1993-1994 financials were published), Total Expenditures for FY1993-1994 were $4,829,154,272. Therefore, the second figure should be the most accurate, given the available data. State employment data are also collected from the legislature’s annual Appropriation Reports, using the same methods described above.
Professional Lobbyist Income
This section deserves separate mention because collecting professional lobbyist income is time- and data-entry-intensive. Professional lobbyist income can be collected and downloaded from the Secretary of State’s website.[33] This report employed a methodology similar to that used in studies conducted by journalists at the Denver Post and the Colorado Sun.[34],[35] Once collected, the data were imported into Excel, where filters were applied to exclude entries in which lobbying firms paid their lobbyists, to avoid double-counting income. Entries were also excluded in which lobbying firms paid other lobbying firms, to avoid double-counting income from contracted work. Once filtered, the data were summed by year, then adjusted for inflation and population (see above).
Tax Data
The effective tax rate data were collected from Colorado’s Department of Revenue’s Bi-Annual Tax Profile and Expenditure Reports.[36] The earliest available year for the effective tax rate data was 2001, and the most recent data came from the 2024 report, which used 2020 data.
[*] “Enterprise” means a government-owned business authorized to issue its own revenue bonds and receiving under 10% of annual revenue in grants from all Colorado state and local governments combined.” See Endnote 1.
[†] See ‘Areas for Future Research’ for more metrics of growth.
[1] Dave Kopel, Colorado Constitutional Law & History Second Edition (Lake Mary, Florida: Vandeplas
Publishing LLC, 2022), 396.
[2] Ibid., 394.
[3] Staff, “TABOR: Restrictive Tax Policy Limits Economic Mobility,” Bell Policy Center, October 31, 2025, https://bellpolicy.org/tabor-restrictive-tax-policy-limits-economic-mobility/#:~:text=TABOR%20applies%20to%20all%20levels,above%20that%20cap%20to%20taxpayers.
[4] Colorado Legislative Staff, “Understanding the State Budget: The Big Picture,” Colorado General Assembly, (November 18, 2022), 4, https://content.leg.colorado.gov/sites/default/files/images/r22-929_understanding_the_state_budget.pdf.
[5] Marianne Goodland, “Ballot measure seeks tax hike for higher income earners in 2026,” Colorado Politics, (September 3, 2025), https://www.coloradopolitics.com/2025/09/03/ballot-measure-seeks-tax-hike-for-higher-income-earners-in-2026/.
[6] Staff, “Appropriations Reports,” Joint Budget Committee, via “Search Publications,”
[7] Federal Reserve Bank of St. Louis (FRED), “Gross Domestic Product: All Industry Total In Colorado (CONGSP), U.S. Bureau of Economic Analysis, (September 26, 2025), https://fred.stlouisfed.org/series/CONGSP.
[8] Staff, “Appropriations Reports,” Joint Budget Committee, via “Search Publications,” https://content.leg.colorado.gov/publication-search?search_api_fulltext=appropriations+reports&field_year=All&sort_bef_combine=field_date_DESC.
[9] Bureau of Economic Analysis (BEA), “The Expenditures Approach to Measuring GDP,” (June 3, 2025),
https://www.bea.gov/news/blog/2025-06-03/expenditures-approach-measuring-gdp.
[10] Daniel R. Carroll, “Why do Economists Still Disagree over Government Spending Multipliers?”, Federal Reserve Bank of Cleveland, (May 8, 2014), https://www.clevelandfed.org/publications/economic-commentary/2014/ec-201409-why-do-economists-still-disagree-over-government-spending-multipliers.
[11] Séverine Menguy, “How Harmful Is a High Share of Public Expenditure in GDP,” Economies 13, no. 3: 74., 2025, https://doi.org/10.3390/economies13030074.
[12] Committee for a Responsible Federal Budget (CRFB), “Interest Costs Have Nearly Tripled Since 2020,” (November 20, 2024), https://www.crfb.org/blogs/interest-costs-have-nearly-tripled-2020.
[13] Staff, “Appropriations Reports,” Joint Budget Committee, via “Search Publications,”
[14] Federal Reserve Bank of St. Louis (FRED), “All Employees: Total Private in Colorado
(SMS08000000500000001), December 12, 2025,
https://fred.stlouisfed.org/series/SMS08000000500000001.
[15] Federal Reserve Bank of St. Louis (FRED), “Real Median Household Income in Colorado
(MEHOINUSCOA672N), (September 9, 2025), https://fred.stlouisfed.org/series/MEHOINUSCOA672N.
[16] Russell S. Sobel and J. R. Clark, “Interest Group Activity and Government Growth: A Causality Analysis,” Cato Journal, (Fall, 2016), https://www.cato.org/sites/cato.org/files/serials/files/cato-journal/2016/9/cj-v36n3-3.pdf.
[17] Staff, “Appropriations Reports,” Joint Budget Committee, via “Search Publications,”
[18] Colorado State Demography Office, “SDO State Demography Summit Page,” under “Summit Materials,” Colorado Department of Local Affairs, (November 7, 2025), https://demography.dola.colorado.gov/assets/html/summit.html.
[19] Linda Gorman, “Evaluating Health Care Reform Proposals: A Primer,” Independence Institute, (2020), https://i2i.org/wp-content/uploads/IP-1-2020_f.pdf, 66.
[20] Staff, Colorado Department of Healthcare Policy & Financing, “Statewide Fact Sheet 2025,” (2025), https://hcpf.colorado.gov/sites/hcpf/files/Statewide%20Fact%20Sheet%20FY25.pdf
[21] Governor Jared Polis, “Driving Out Poverty: Colorado Among the Lowest Poverty Rates in America,” Governor’s Office, (September 4, 2025), https://governorsoffice.colorado.gov/governor/news/driving-out-poverty-colorado-among-lowest-poverty-rates-america.
[22] Colorado Department of Revenue, “2024 Tax Profile and Expenditure Report,” (December, 05, 2024), https://drive.google.com/file/d/1Ydw79EwzI8XVlD44_4z302TKfT3CwGnG/view.
[23] Ibid., 254.
[24] Colorado Department of Revenue, “Colorado Tax Profile Study 2001 and Statistics of Income,” (May 20,
2004), https://drive.google.com/file/d/1Ydw79EwzI8XVlD44_4z302TKfT3CwGnG/view, 3-4.
[25] Ben Murrey and Mark Berndt, “Colorado Tax Expenditure Modifications, 2023: Special Interest Tax Benefits Vs. Broad-Based Tax Relief,” Independence Institute, (January, 2024), https://i2i.org/wp-content/uploads/IP_1_2024_g.pdf.
[26] Chris Keating, “Colorado Independent Voter Poll Key Findings Presentation,” Keating Research, (December 11, 2025), https://letcoloradovote.com/wp-content/uploads/2025/12/KR-Colorado-Independent-Voters-Key-Findings-Presentation-Draft-3-12-10-25-FOR-WEBINAR.pdf.
[27] Janelle Fritts et al, “2026 State Tax Competitiveness Index,” Tax Foundation, (October 30,2025), https://taxfoundation.org/research/all/state/2026-state-tax-competitiveness-index/.
[28] Aldo Svaldi, “Is Colorado at risk of becoming the New Jersey of the West?”, The Denver Post, (January 6, 2026), https://www.denverpost.com/2026/01/06/colorado-outbound-moves-population-migration/.
[29] Staff, “What is Debrucing?”, Bell Policy Center, July 12, 2019, https://bellpolicy.org/what-is-debrucing/.
[30] Legislative Council Staff, “Consumer Price Index, All Items (CPI-U),” Colorado General Assembly, (December, 2025), https://content.leg.colorado.gov/sites/default/files/2025-12/CPI%20History%20and%20Forecast%20December%202025.pdf.
[31] Federal Reserve Bank of St. Louis (FRED), “Resident Population in Colorado (COPOP)”, (December 23,2024), https://fred.stlouisfed.org/series/COPOP.
[32] Staff, “Appropriations Reports,” Joint Budget Committee, via “Search Publications,” https://content.leg.colorado.gov/publication-search?search_api_fulltext=appropriations+reports&field_year=All&sort_bef_combine=field_date_DESC.
[33] Colorado Secretary of State, “Professional Lobbyist Income,” Colorado Information Marketplace (2026),
https://data.colorado.gov/Legislative/Professional-Lobbyist-Income/95mi-seny.
[34] Nick Coltrain, “Colorado lobbyists were paid nearly $70 million in the last year. These 5 bills show their
influence on policy,” The Denver Post, (July 7, 2024), https://www.denverpost.com/2024/07/07/colorado-legislature-lobbying-democrats-environment-oil-gas-housing-chemicals/?share=coacl2gowom0rsdog7ao.
[35] Sandra Fish, “A record amount was spent lobbying Colorado’s legislature and state government last year,”
The Colorado Sun, (August 10, 2023), https://coloradosun.com/2023/08/10/colorado-lobbying-2023-record/.
[36] Colorado Department of Revenue, “Tax Profile and Expenditure Reports,” under “Data and Reports,” (2025), https://cdor.colorado.gov/data-and-reports.