
When parents choose a school for their child, there are numerous factors that come into play. Who is the child and what are their needs? How close is the school, and can the family easily access it? Is the school safe? Will the other children create a good community? How kind and dedicated are the teachers?
Interestingly, when asked why they’ve chosen a particular school for their child, American parents tend to put the academic quality of the school below factors like a convenient location, desirable peers, assigned school districts, or a safe environment.
While these factors are all certainly important for the health and well-being of a child, it’s also worth wondering why academic quality is ranked so low. It’s possible that parents feel that they have no real way to assess a school’s academic quality from the outside, so they depend on the school factors that they can see: happy children, pleasant teachers, and reports of school quality floating through the parent grapevine.
A school’s academic climate can significantly affect long-term student success. Parents should, at the very least, know the current academic outcomes at their child’s potential school before deciding if the environment is a good fit for their child.
Thankfully, Minnesota’s Department of Education provides an accessible tool to know academic facts about every public and charter school: the Minnesota Report Card. It’s easily found online, or you can click this link.
How can one use the Report Card?
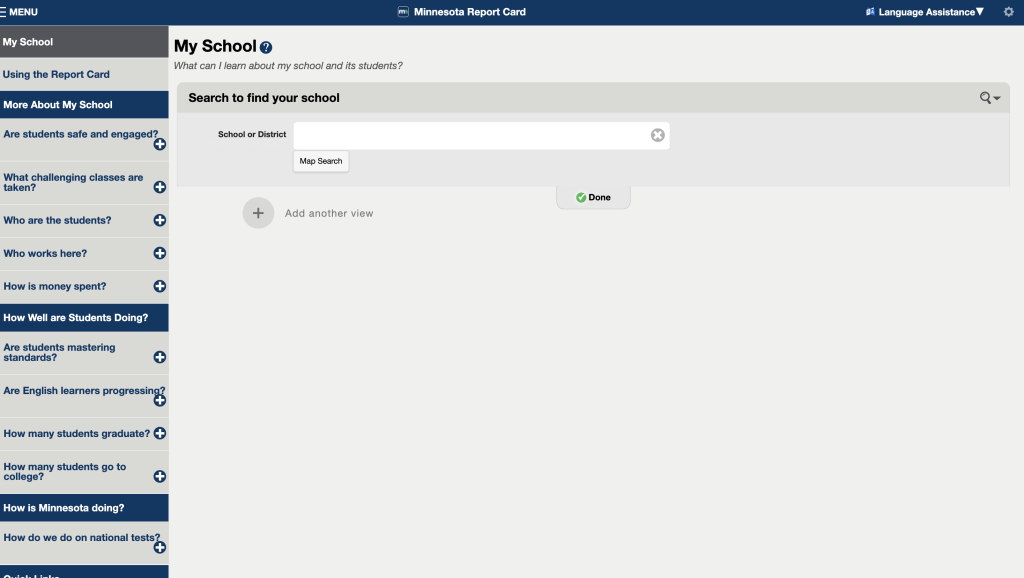
Start by visiting the website. There, you’ll see a menu that allows you to type in the school you’re interested in.
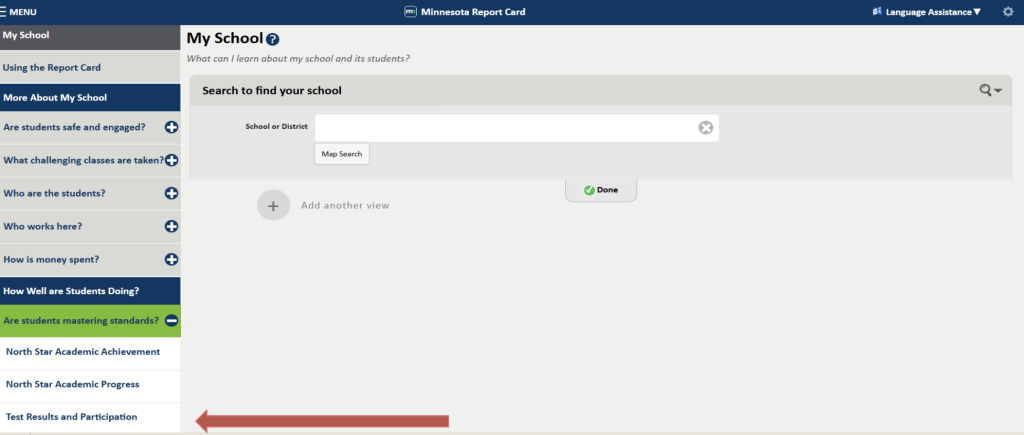
To find your school’s test scores, click on the dropdown menu in the lower left hand corner titled, “Are students mastering standards?” Then, click on “Test Results and Participation.”
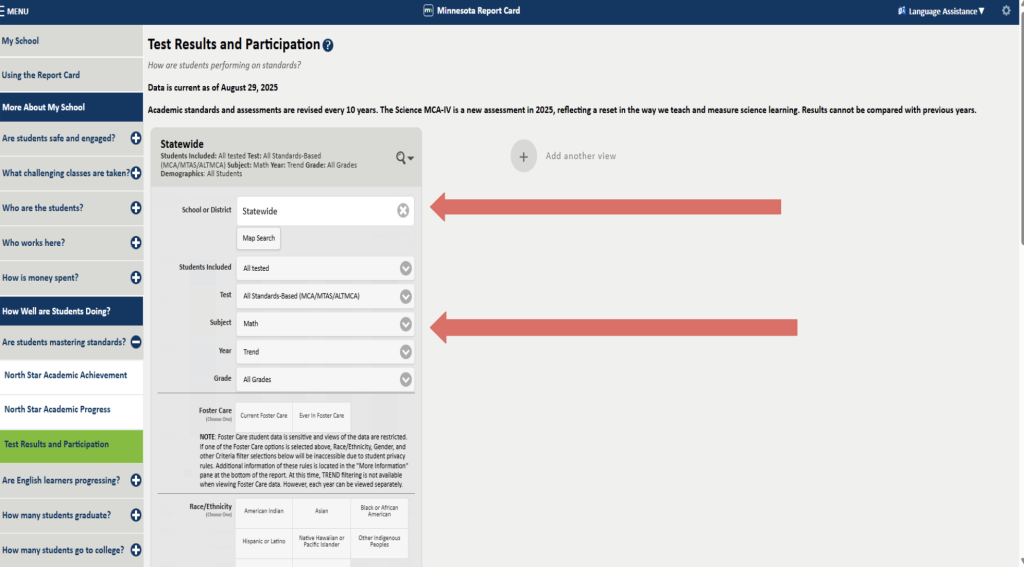
You’ll be taken to the screen below.
Make sure that the school or district you’re hoping to find is typed in the uppermost box. From there, you can sort by subject: Math, Reading, or Science. It’s possible to sort scores by other data points, but not necessary for an initial first glance. Scroll down to click “Done” and see test scores.
Once you choose a school or district, simply scroll down to “Proficiency” to find an easily understandable trendline analysis. For the sake of an example, I chose the Edina Public School District’s reading scores. Here’s what I found:
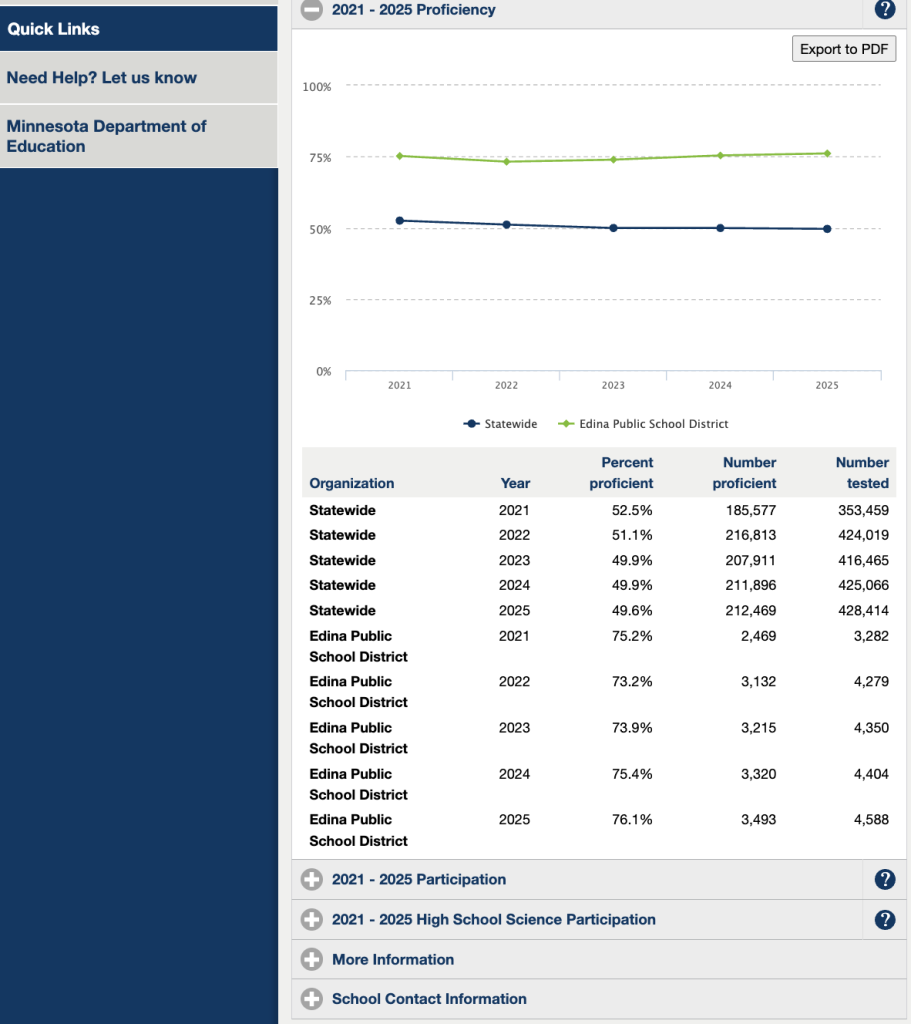
This trendline graph and the caption below informs me that in 2025, 76.1 percent of all Edina Public School students scored as proficient or higher on their reading state test, as opposed to 49.6 of all of Minnesota’s public school students. Congratulations, Edina!
How do I interpret these proficiency rates?
The Minnesota Comprehensive Assessment (MCA) and equivalent tests like the MTAS and ALTMCA (tests given to students with learning differences) are only administered in certain grade years. Math, reading, and science are all administered in grades 3-8, meaning that parents of younger students can feel strongly comfortable gauging the academic reliability of a child’s school by looking at test scores. Additionally, math is administered in 11th grade, reading in 10th grade, and science at one point in high school.
The MCA Science test is a new test, changing over in 2025. It is not fully accurate to compare the results connected to the new test format with results from previous years.
The proficiency calculation only includes students who have taken the test. It denotes students who have tested as proficient or above proficient under MCA benchmarks.
Testing is one data point among many. A school that contains a student body that tends to struggle at home might hold passionate educators and high-quality instruction and still post lower-than-desired test scores. Sometimes, a seemingly low test score actually signals that a school is a bright spot of education, and students are beating the odds.
However, that’s not the case for every school. It’s important to hold schools accountable for their academic quality. Ideally, schools should be able to show gradually increasing test scores as they adapt to the needs and circumstances of their students.
It’s a clear win if a school scores far above the state’s (worryingly dropping) average MCA scores: 49.6 percent of students are proficient in reading, and 45.2 percent are proficient in mathematics.
Ultimately, parents should weigh testing proficiency alongside other concerns like school community, school safety, and school accessibility to make the right choice for their child. The best expert on what every child needs should be their parent.
Parents should remember that while the academic quality of a school matters heavily, a wide body of research shows that parental involvement is perhaps the most important indicator on whether or not a child will do well in school. A peaceful home environment, high but reasonable scholastic expectations, and consistent parental academic accountability can transform the trajectory of a child’s life, no matter where they attend school.