In every year since 2001, the federal government has spent more money than it collects in taxes. As Figure 1 shows, while federal revenues have increased from $2.0 trillion in 2001 to 5.2 trillion in 2025 — a rise of 163% — outlays have risen from $1.9 trillion to $7.0 trillion, an increase of 276%. As a result, a near balance in the federal budget in 2001 has turned into a deficit of $1.8 trillion in 2025.
Figure 1: Federal government finances, trillions
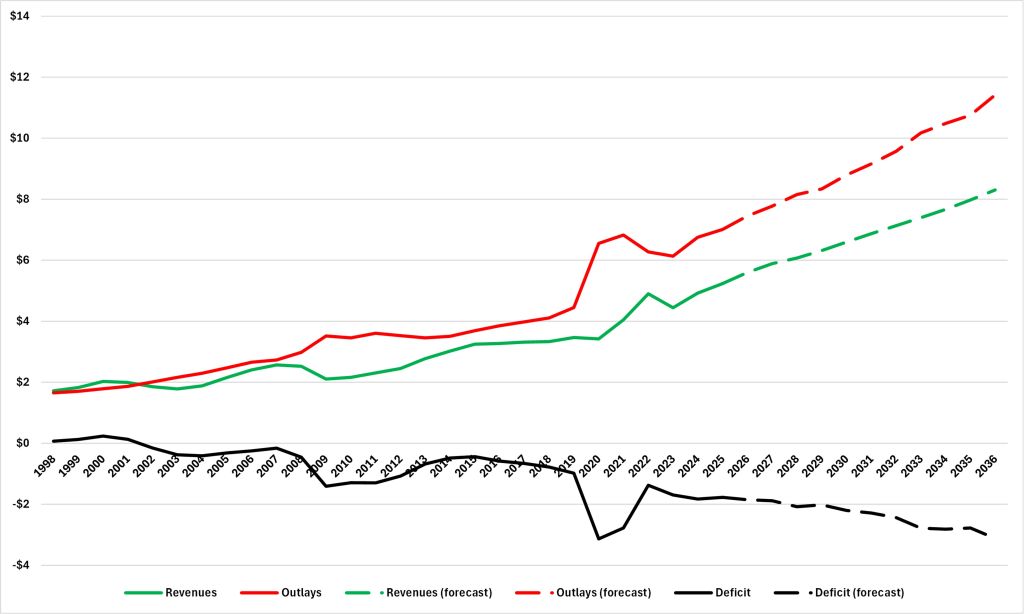
Figure 1 also shows that the federal government’s finances are set to get even worse. The Congressional Budget Office (CBO) forecasts that revenues will rise by 59% by 2036 to $8.3 trillion but that outlays will rise by 63% to $11.4 trillion. As a result, the budget deficit will hit $3.1 trillion.
As Figure 2 shows, the result of all this borrowing is that federal “Debt held by the public” has risen from $3.3 trillion in 2001 to $30.2 trillion in 2025. And, because this debt has generally increased at a faster rate than national income (Gross Domestic Product or GDP), it has risen as a share of national income from 31.5% in 2001 to 99.4% in 2025.
Figure 2: Federal government debt
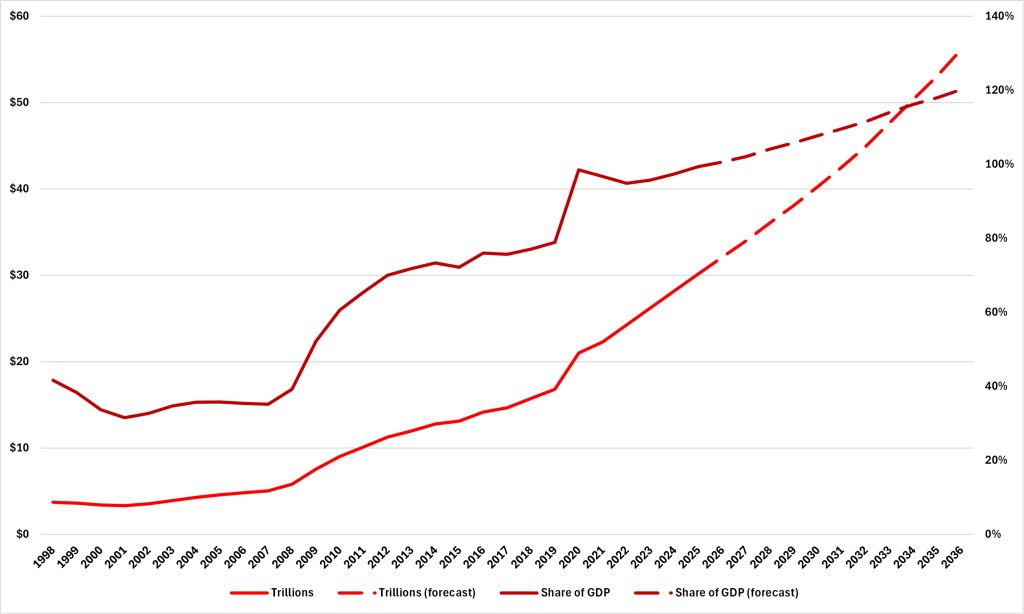
Again, this is all set to get worse. As Figure 2 also shows, the CBO forecasts that, by 2036, federal government debt will hit $56.2 trillion or 120.2% of national income.
What has driven this explosion of debt and what will drive it from now until 2036?
The federal budget is split between” discretionary” and “mandatory” items. Discretionary spending is the portion of the federal budget that Congress controls through annual appropriations acts. It includes things like defense, which makes up 47.7% of the discretionary total, up from 47.2% in 2001. Mandatory, or “non-discretionary” spending is the portion of the federal budget dictated by ongoing statutory laws rather than the annual congressional appropriations process; it is essentially on autopilot. It includes things like Social Security and Medicare, which make up 66.1% of the mandatory total.
Figure 3 shows that mandatory spending is the culprit. While discretionary spending increased by 188% between 2001 and 2025, mandatory spending increased by 314%. Looking forward to 2036, the CBO forecasts discretionary spending rising by another 20% while mandatory spending increases by 69%. In short, federal entitlement programs like Social Security and Medicare are eating the budget alive.
Figure 3: Federal government spending, trillions
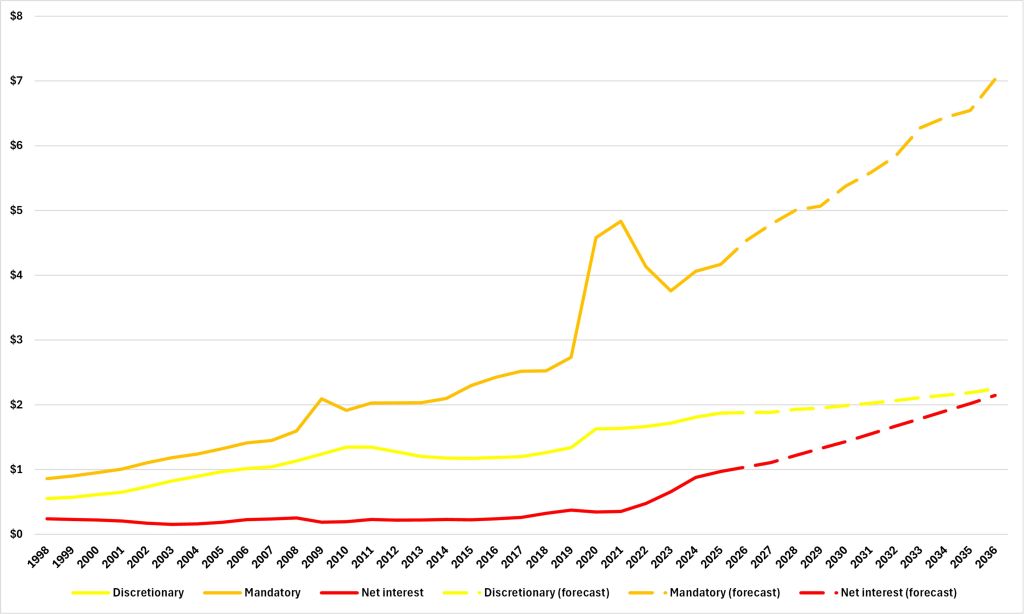
There is a third category of federal government spending: “Net interest.” This is simply the interest on all that debt the federal government has accumulated on our behalf. Until 2021, this chugged along at about $200 billion annually. Since then, partly as a result of increased borrowing (deficits) and partly as a result of higher borrowing costs (interest rates), it has spiked to $1.0 trillion; indeed, in 2024, the federal government spent more on net interest than on defense for the first time. And, again, this is forecast to get worse. Net interest payments are forecast to hit $2.1 trillion in 2036, when it will equal the total of discretionary spending. This is with interest rates of 4.3%; if they go above that so will forecast net interest payments.
We cannot tax our way out of this.
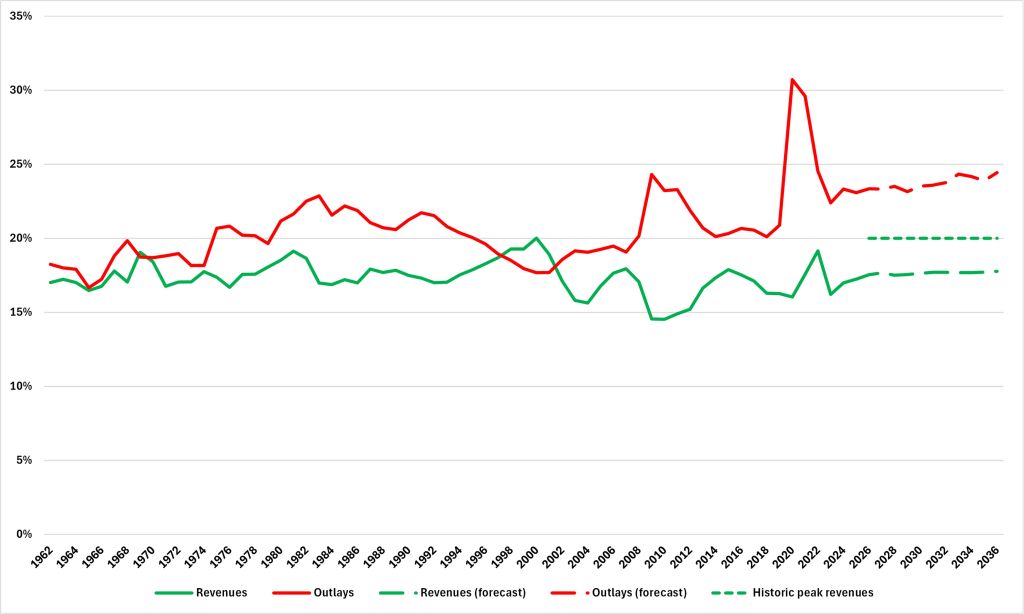
The CBO forecasts that federal government spending will rise from 23.1% of GDP in 2025 to 24.4% in 2036. Yet, as Figure 4 shows, in the best year ever for federal government revenues as a share of GDP – 2000 – the amount taken was 20.0% of GDP. In other words, even if taxes as a share of national income could rise to match the highest level since 1962, there would still be a deficit of 4.4 percentage points in 2036.
Figure 4: Federal government finances, share of GDP
This ought to be the biggest issue in American politics, but there is depressingly little appetite on either side of the aisle to tackle this growing crisis. Its effects will be felt by all of us, and one way it will manifest is through increasing pressure on state budgets.