
New results from the National Assessment of Educational Progress (NAEP) Long-Term Trend (LTT) assessments in reading and math tell different stories for 9 and 13 year olds.
Since the 1970s, NAEP has used these paper-based assessments to measure the academic performance of U.S. students over time — hence “long-term trend.” The tests provide a snapshot of performance among nationally representative samples of 9- and 13-year-old students in public and private schools, weighted to reflect national enrollment patterns.
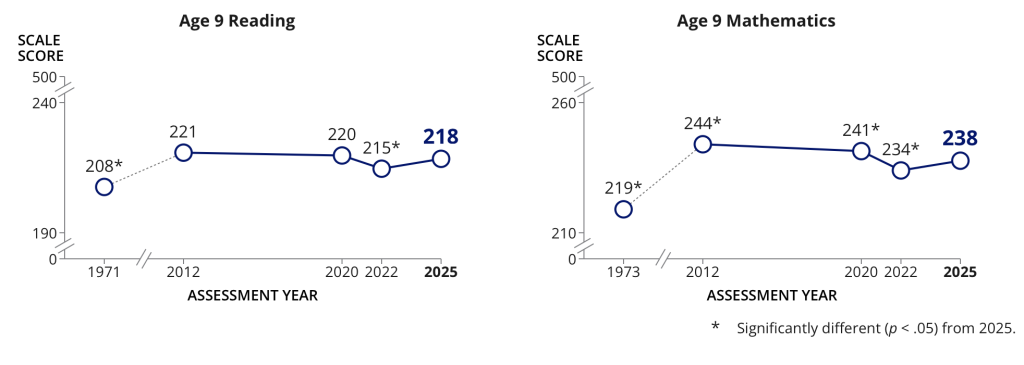
Between 2022 and 2025, average reading and math scores for 9 year olds increased, with lower performers largely driving the gains. Compared to pre-COVID 2020 results, the average reading score was not significantly different but the average math score is still lower. Performance has jumped considerably since the 1970s when the tests were first administered, but they are still below the 2012 peak.
NAEP Long-Term Trend Assessment Results
Reading & Math, Age 9
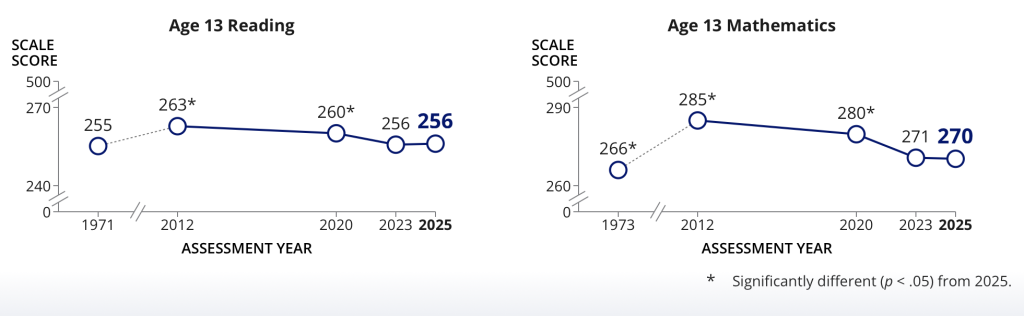
Reading and math performance among 13-year-old students, however, hasn’t moved meaningfully since 2023, and compared to 2020, both reading and math are still down. Reading performance is about what it was in the 1970s; math is slightly higher. Like the younger group, their 2025 average scores are well below their 2012 highs.
NAEP Long-Term Trend Assessment Results
Reading & Math, Age 13
The stagnation among 13 year olds was not entirely surprising, said Kirsten Baesler, assistant secretary for Elementary and Secondary Education at the U.S. Department of Education. Those students were in 2nd and 3rd grade when COVID shut schools down.
“They were in some of their most formative years of both literacy and numeracy, and it was a seismic event,” Baesler told The 74. “It’s going to take equally seismic effort to ensure that those students are coming back to where they need to be.”
But the troubling trends predate COVID.
Both age groups saw test scores peak in 2012. Since then, scores have generally moved in the wrong direction. Researchers at Stanford, Harvard, and Dartmouth have documented the same decline in other achievement data and point to two changes that happened around the same time: “policymakers switched off the early warning system of test-based accountability and social media took over children’s lives.”
Beginning in 2013, the Obama administration started granting states waivers from key provisions of the No Child Left Behind Act. While this federal education law was controversial, the years it was in force coincided with a sustained period of rising scores, especially among the lowest-performing students. Congress replaced it with the Every Student Succeeds Act in 2015, which eased federal accountability requirements. As Chad Aldeman argued in The 74, student performance began slipping shortly after.
Around the same time, social media use among teenagers was exploding. Pew Research found that the share of teenagers who reported being online almost constantly nearly doubled between 2014-15 and 2022, from about 25 percent to close to 50 percent. Based on international test data, the largest academic declines have been concentrated among lower-achieving students, who also tend to spend the most time on social media. In response to growing concerns about screen time, dozens of states have passed or considered laws restricting teen social media use and phone use in schools.
The modest gains among 9 year olds on the 2025 LTT assessments are encouraging. But they also shouldn’t distract from what the 13-year-old results are telling us. If policymakers want to reverse this trend, they might start by looking at what was abandoned when scores were still going up.