Electricity prices started to become more-and-more unaffordable in Minnesota from 2002 onwards. This was driven by the state’s: 2001 Renewable Energy Objective (REO); 2007 Renewable Energy Standard (RES); 2022 Climate Action Framework (CAF); and 2023 Clean Electricity Standard (CES).
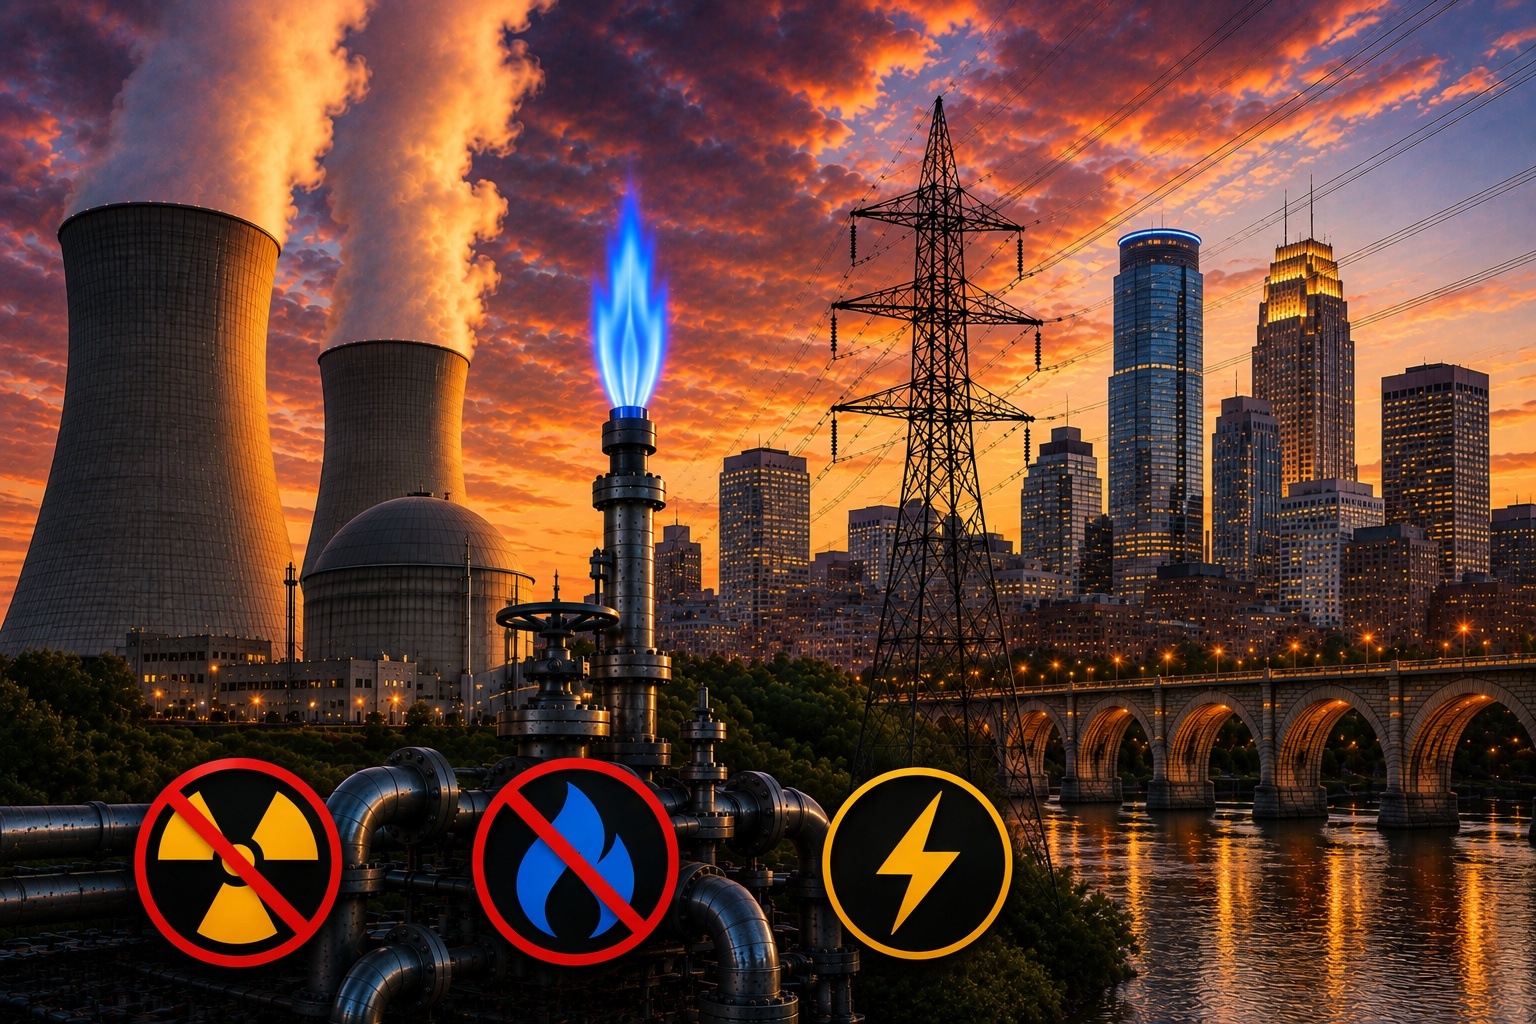
Electricity unaffordability is made far worse by two bans. One is the current ban on any new nuclear electricity generation since 1994. The other is the planned ban, under the 2021 Natural Gas Innovation Act (NGIA), on natural gas use in most homes and workplaces, by 2050, perhaps 2040 or even 2030.
The lack of additional nuclear generation has already contributed to electricity inflation since 2002. This has been mitigated by the addition of natural gas generation. However, the latter is 3 times more expensive than the former, and is usually better suited to peak-load than base-load. Although, wind and solar are 8x and 13x more expensive respectively than nuclear.
Prices
Electricity prices have been inflating in a sustainable way since 2002, as renewables increased, coal decreased and nuclear stayed the same, through to 2025. Natural gas prices, on the other hand, have slightly deflated over this same period of time.
- Chart 1 below shows that electricity prices, in dollars per one million British thermal units ($/MMBtu), rose by +118% from $16.99 in 2002 to $37.12 in 2025.
- Chart 1 also shows that natural gas prices ($/MMBtu) fell by -9% from $5.33 in 2002 to $4.86 in 2025.
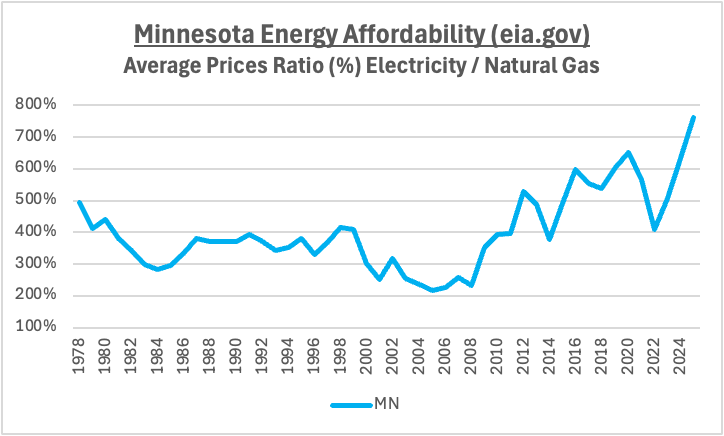
- Chart 2 below plots the ratio (%) of electricity to natural gas prices, demonstrating that it skyrocketed by 3.5x from 216% in 2005 to 763% in 2025.
Chart 1
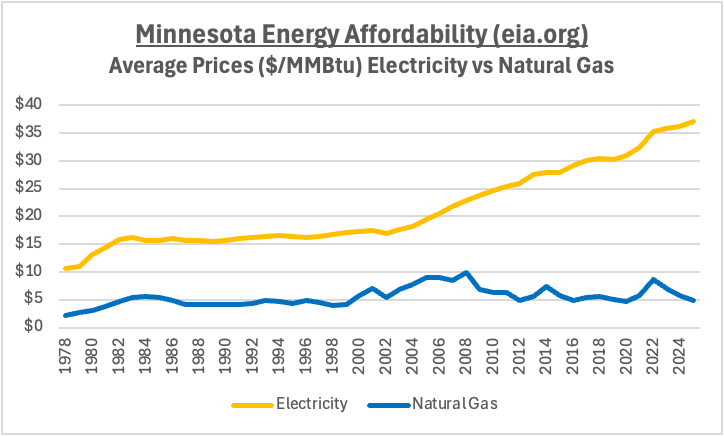
Chart 2
Uses
Electricity usage grew from 1978 to 2008, then has declined since, until 2025. Natural gas usage grew from 1978 to 1996, then took off in 1997 and 1998, as it started being used for electricity generation, in addition to residential, commercial and industrial uses.
- Chart 3 below shows electricity use (MMBtu) growing by +120% from 107 Million in 1978 to 235 Million in 2008 but then shrinking by -5% to 224 Million in 2025.
- Chart 3 also shows natural gas use (MMBtu) nicely grew by 28% from 195 Million in 1978 to 250 Million in 1996 but then took off by 100% to 501 Million in 2025.
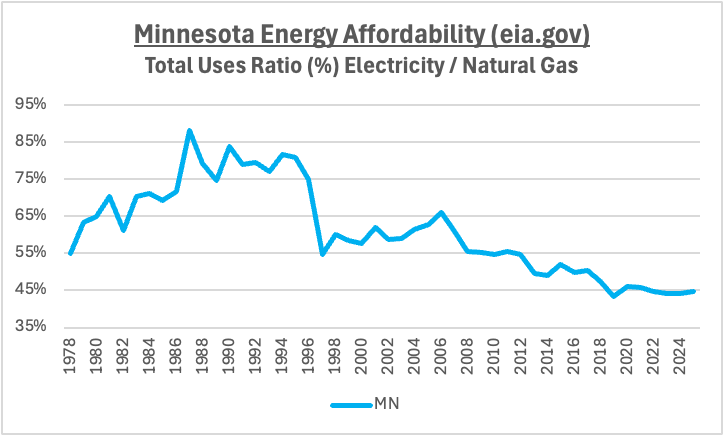
- Chart 4 demonstrates below that the ratio of electricity to natural gas uses halved from a high of 88% in 1987 to a low of 43% in 2019 then flattened out since.
Chart 3
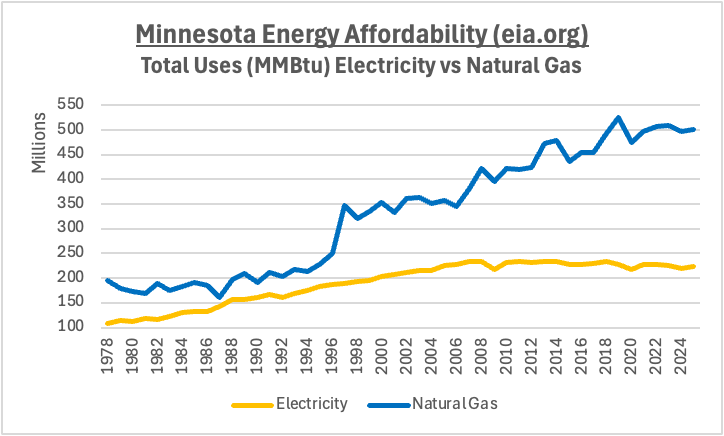
Chart 4
Revenues
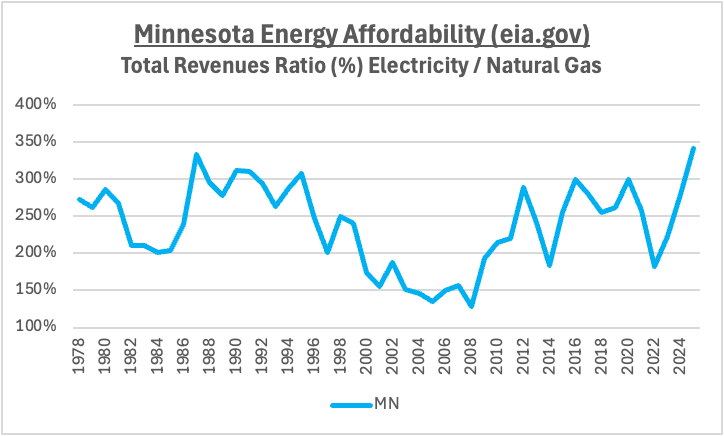
Revenues, which are prices times uses, started to noticeably pile up for electricity public utilities in the renewables era, from 2002 onwards, and for natural gas companies in the electricity generation era, from 1997 onwards. The former has since reinforced the latter.
- Chart 5 below shows that electricity revenues increased by 131% from $3.6 Billion in 2002 to 8.3 Billion in 2025.
- Chart 5 also shows that natural gas revenues grew by 145% from $979 Million in 1995 to 2.4 Billion in 2025.
- Chart 6 demonstrates below that the ratio of electricity to natural gas revenues plummeted from 334% in 1987 to 129% in 2008 then exploded up to 341% by 2025.
Chart 5
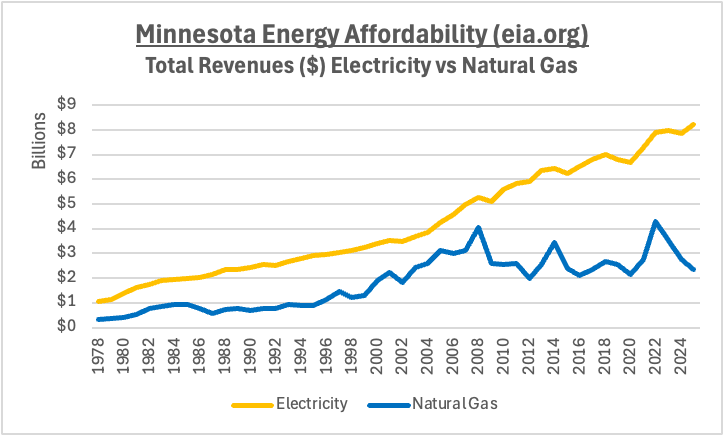
Chart 6
Customers
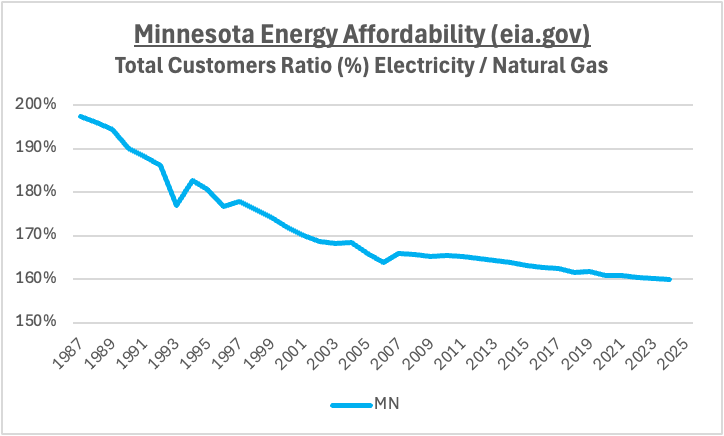
Total electricity customers include residential, commercial, industrial and electricity generation. Total natural gas customers include the first three classes, but not the fourth.
- Chart 7 below shows that electricity customers went from 1.9 Million in 1987 to 2.6 Million in 2008, an increase of 37%, and grew a slower 12% to 2.9 Million by 2025.
- Chart 7 also shows that natural gas customers went from 936 Thousand in 1987 to 1.5 Million in 2006, an increase of 56%, and grew a further 20% to 1.8 Million by 2024.
- Chart 8 demonstrates below that the ratio of electricity to natural gas customers dropped from 197% in 1987 to 164% in 2006, then continued on to 160% by 2024.
Chart 7
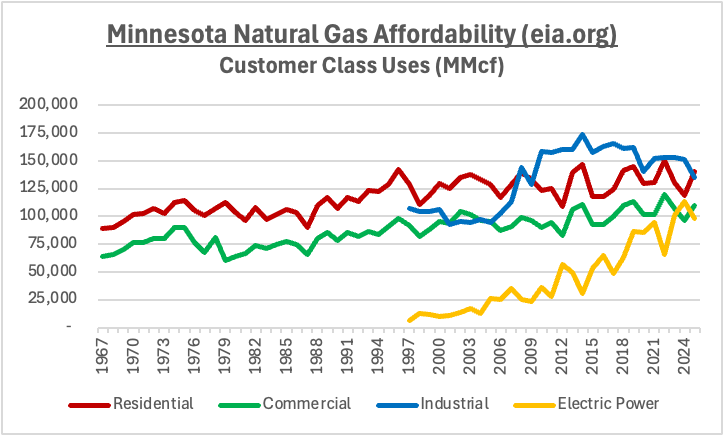
Chart 8
Bills
Bills, which are revenues divided by customers, have been on a serious and sustained rise for electricity customers since 2004, overtaking natural gas bills from 2009 onwards. The latter, however, did spike up close to the former in both 2014 and 2002.
- Chart 9 below shows that electricity bills rose by 36% from $1,175 in 1987 to $1,601 in 2004 and then ramped up another 77% to $2,834 by 2025.
- Chart 9 also shows that natural gas bills went up by +19% from $694 in 1987 to $825 in 1995 before skyrocketing by +226% to $2,688 in 2008, and then has been up-and-down since, although has sunk to -41% lower at $1,574 in 2024.
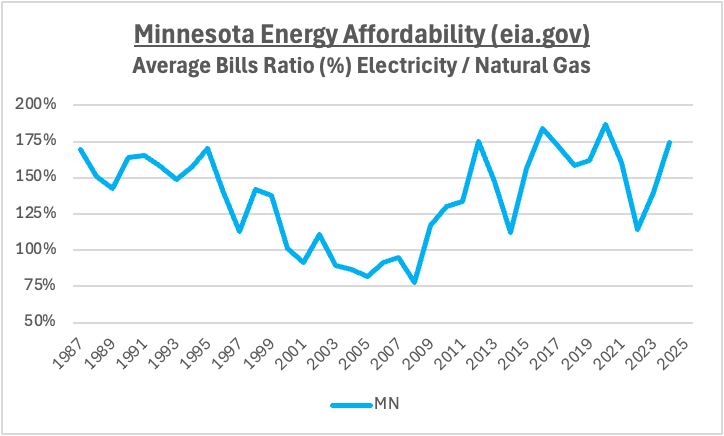
- Chart 10 demonstrates below that the ratio of electricity to natural gas bills fell from 169% in 1987 to 78% in 2008, then reversed course up to 175% in 2012, and roller coastered along to be at 175% again in 2024.
Chart 9
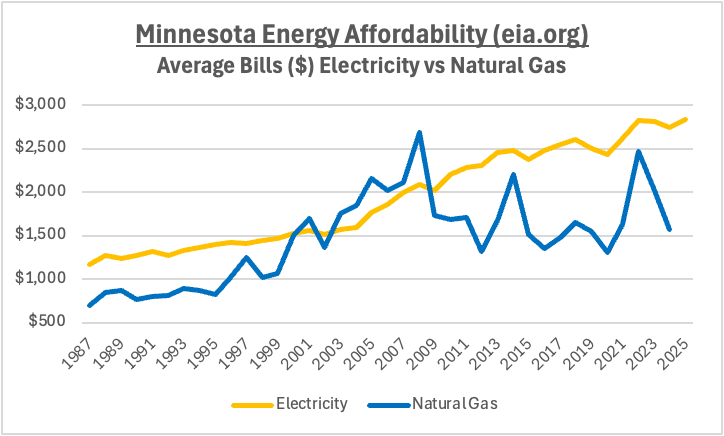
Chart 10
Uses
Natural gas use for electricity generation took off from 1997 onwards. Also from 1997, industrial customers use began to be tracked, along side residential and commercial.
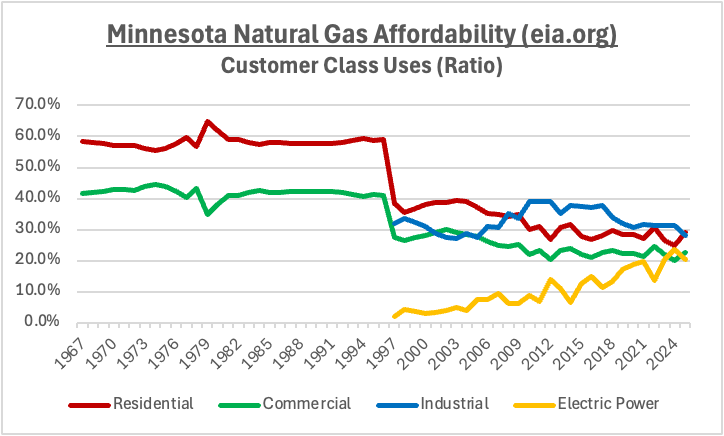
- Charts 11 and 12 below show natural gas use for electricity generation expanding exponentially from 1997 to 2025 by 1,507%, with overall use ratio rising from 2% to 20%.
- Charts 11 and 12 also show, for 1997 to 2025, residential growth of 9%, with overall use ratio falling from 38% to 29%;
- Charts 11 and 12 in addition show, for 1997 to 2025, commercial growth of 19%, with overall use ratio falling from 28% to 23%.
- Charts 11 and 12 show as well, for 1997 to 2025, industrial growth of 26%, with overall use ratio rising from 32% to 28%.
Chart 11
Chart 12
Conclusion
Dear fellow Minnesotans, rise up and have your say on nuclear power by September 14, as well as on natural gas by October 14 and October 21. There is a rare opportunity to both: lift the current ban on new nuclear generation; and stop the planned ban on natural gas use.
Further details are provided below on where to go to have your voice heard, to strongly say “Hands Off My Gas!” as well as “Nuke the Mandate, free the Nukes!” Also contact your state level DFL and GOP officials and candidates, before and after Tuesday November 3.
Nuke the Mandate, Free the Nukes! Minnesota’s time is nigh
Great Plains Institute (GPI) has a website devoted to a Request for Information (RFI) for the Minnesota Nuclear Energy Study. One can either upload a response document or enter responses by topic area in the online form. GPI also has a different website with further information on the study. Responses must be submitted by 11:59 pm on September 14, 2026. In the meantime, questions about this RFI may be submitted by email to GPI at mnnuclearstudy@gpisd.net.
Yet another Minnesota fraud? Natural Gas Innovation Act
Public comments are due by 4:30pm on October 14 to the Minnesota Public Utilities Commission (PUC), regarding CenterPoint Energy‘s annual report, under the NGIA, on their natural gas replacement plans and spending as well as related rate increases.
Public comments are due by 4:30pm on October 21 to the PUC, regarding Xcel Energy‘s annual report, under the NGIA, on their natural gas replacement plans and spending as well as related rate increases. Email: consumer.puc@state.mn.us.
The post Nukes and natural gas: End two bans, for the price of one appeared first on American Experiment.