
The economics of housing affordability
The big buzzword in politics right now is “affordability.” Things aren’t affordable, the argument goes, or are becoming less so, and voters will reward the party which they see as most likely to make things more so.
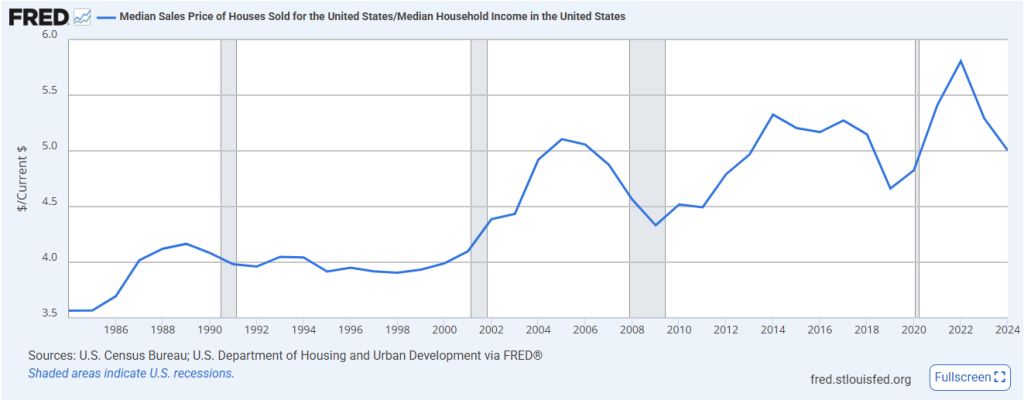
Within this, housing is a particularly pressing concern, and it is easy to see why. There are lots of ways to show this, but, as Figure 1 shows, the median sale price of a new house in the United States has risen from about four times median household income between 1987 and 2001 to an average of about five times since 2013. Given how vital housing is to people, this is a big part of the affordability squeeze.
Figure 1
Econ 101 tells us that the rise in a price is driven by decrease in supply/increase in demand or some mix of both. A way to test this in housing is to look at the stock of it relative to the population. Indeed, Figure 2 shows that as house prices started to tick up as a multiple of household income from about 2001, the stock of housing in the United States responded, growing relative to the population, from 5.5 housing units per ten Americans in 2003 to 5.6 in 2008; “the cure for high prices is high prices,” as the old saying goes.
Figure 2
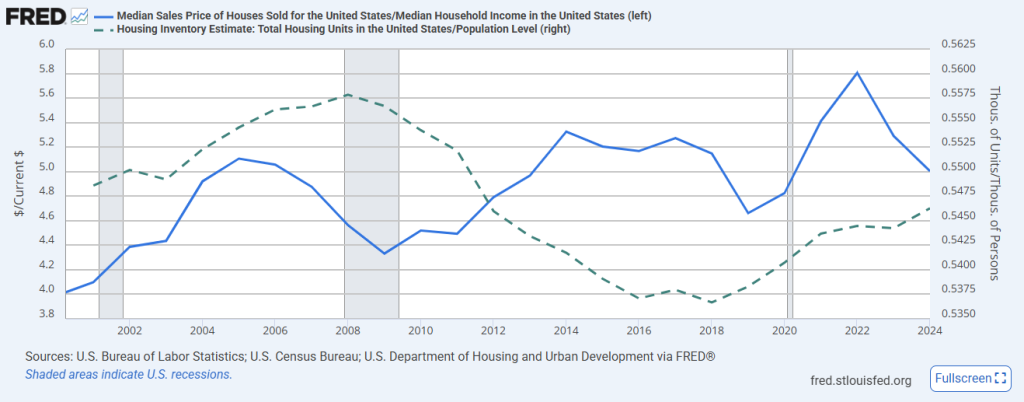
After 2008, however, the ratio fell to a low of 5.4 in 2018 and house prices as a multiple of household income marched up from 4.3 in 2009 to 5.8 in 2022. This slump in the housing stock relative to the population occurred because house building fell off a cliff in 2005, as Figure 3 shows. That year, 2.1 million houses were started in the United States, but this fell to 554,000 in 2009. The number of starts drifted up from there and picked up pace from 2019 to 2021, driving that increase in the housing stock relative to the population and decline in house prices as a multiple of household income since 2022 seen in Figure 2.
Figure 3
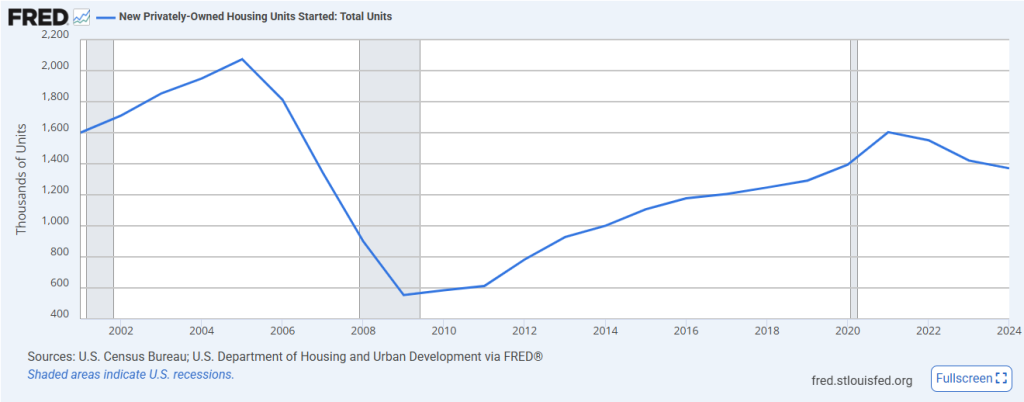
Worryingly, housing starts have drifted down since then. This, the record suggests, will drive upward pressure on house prices, ceteris paribus.
The politics of housing affordability
The record on house building is not uniform across the United States and, consequently, neither is the record on housing affordability.
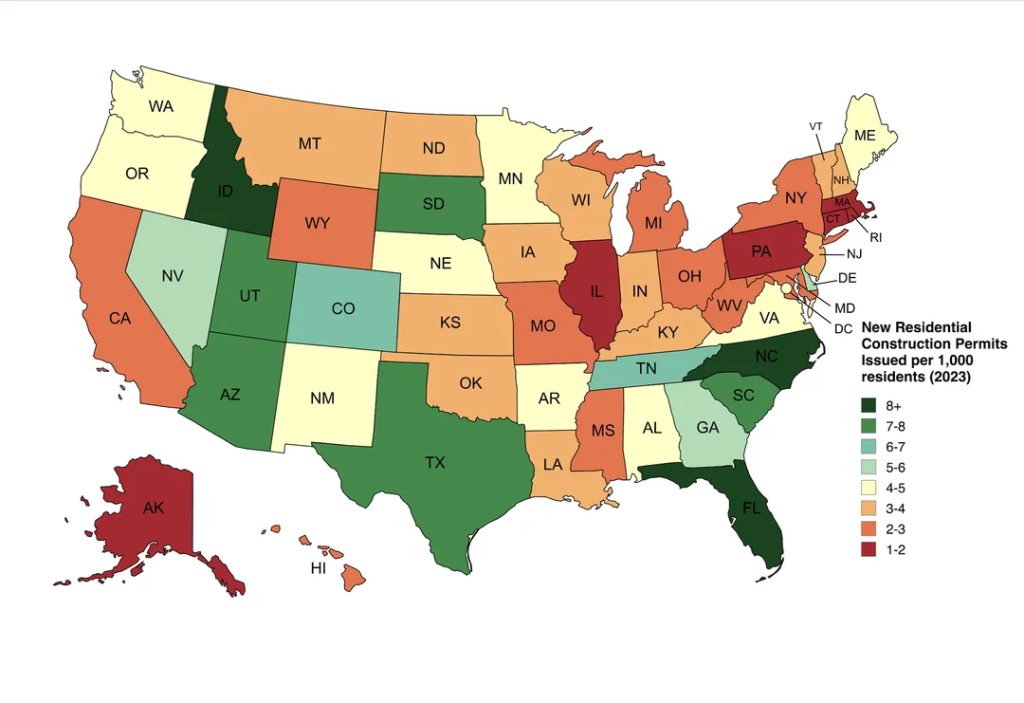
Figure 4 shows that the number of residential construction permits issued per 1,000 residents in 2023 ranged from more than eight in Idaho, North Carolina, and Florida, to between one and two in Alaska, Illinois, Pennsylvania, Massachusetts, Connecticut, and Rhode Island.
Figure 4
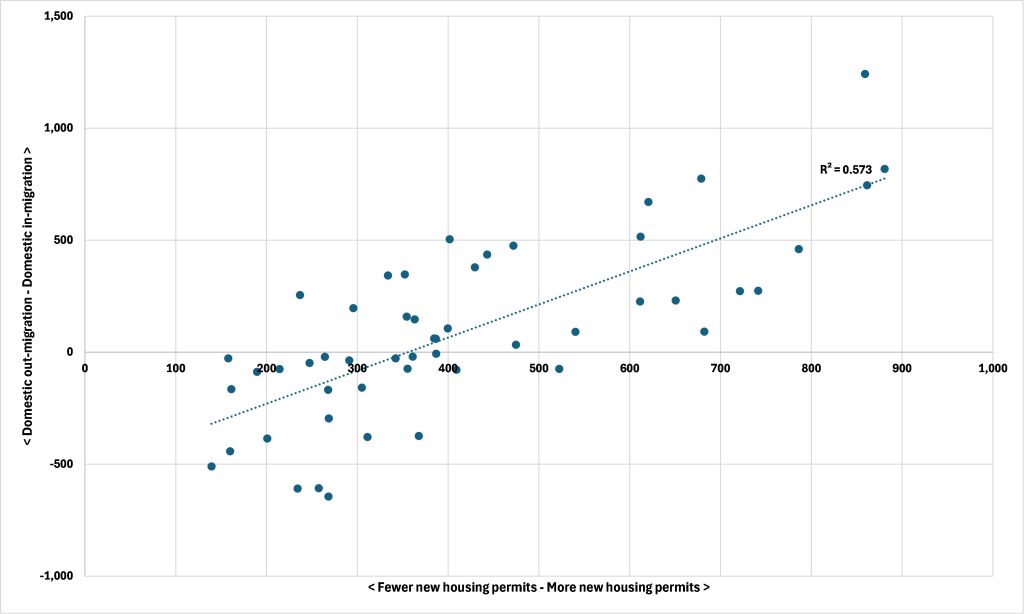
And people move to where they can find a place to live. Using Census Bureau data on population and housing, Figure 5 shows the rate of New Privately Owned Housing Units Authorized per 100,000 residents for 2024 on the x (horizontal) axis and the Net Domestic Migration rate per 100,000 residents for 2024 on the y (vertical) axis. The relationship is statistically significant, and variations in the rate of housing permit issuance can explain 57.3% of the variation in net domestic migration rates in 2024.
Figure 5: Relationship between house building and net domestic migration
Is there a political aspect to this? According to Ballotpedia, in 2024 there were 23 states, including North Dakota, with a Republican trifecta — we’ll call this “Red America” — and seventeen states, including Minnesota, with a Democratic trifecta, which we will call “Blue America.” Adding together state totals in each for population, net domestic migration, and new houses permitted, we can calculate net rates per 100,000 residents of housebuilding and net domestic migration for Red and Blue America.
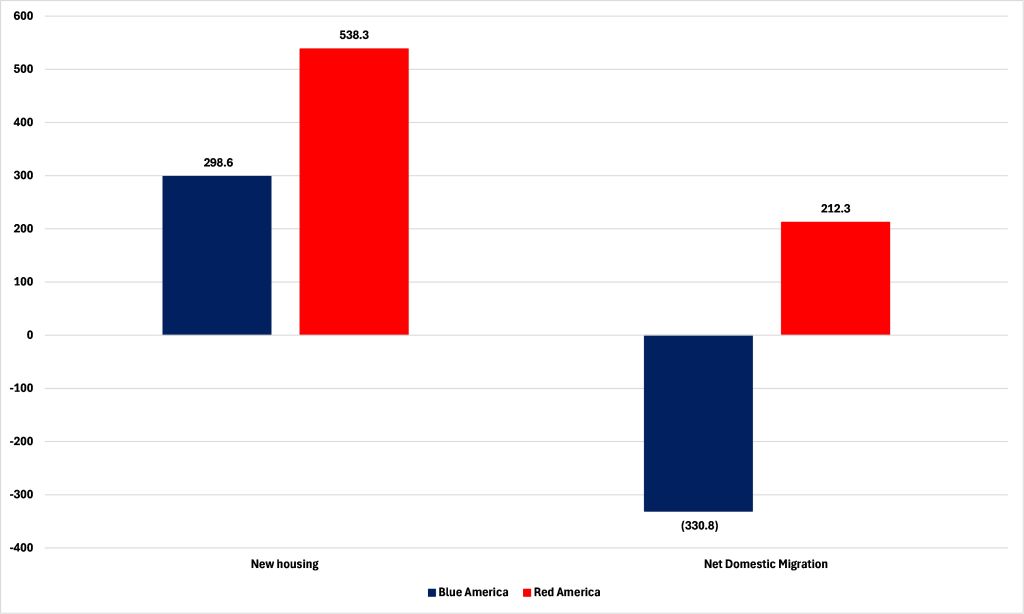
Figure 6 shows that, in 2024, Red America had a housebuilding rate — 538.3 per 100,000 residents — 1.8 times greater than Blue America, with 298.6. For domestic migration, Blue America lost 330.8 people per 100,000 residents in 2024 while Red America gained 212.3.
Figure 6: New housing and net domestic migration rates per 100,000 residents, 2024
Why is it that Blue America finds it so mich harder to build houses than Red America? That is a question to which we shall return, and it is one of great consequence.