Back in October, I wrote about Minnesota’s relatively poor performance on GDP per capita growth in the last decade:
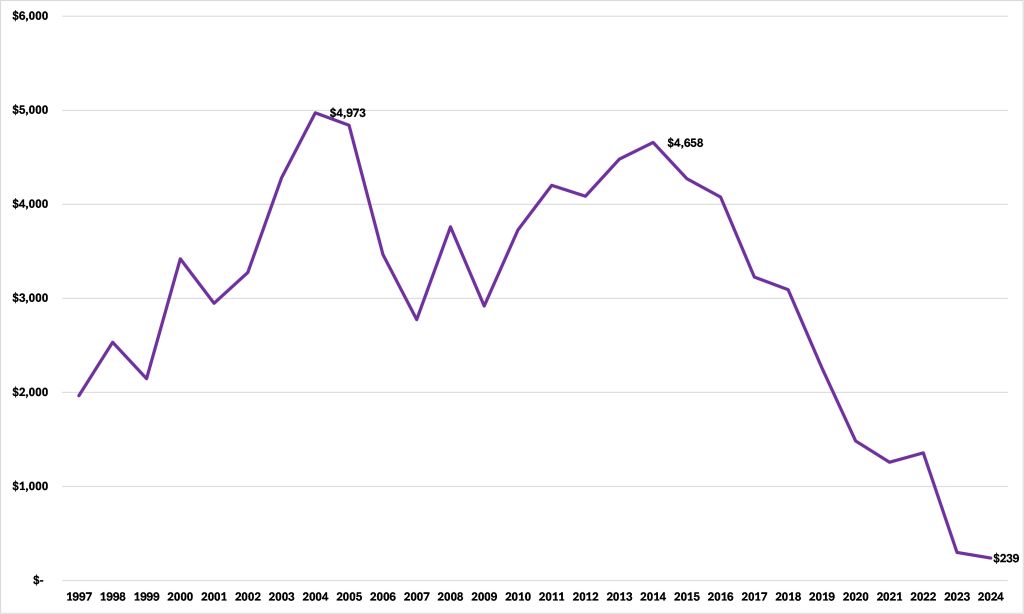
Data from the Bureau of Economic Analysis (BEA) show that in nine of the ten years since 2014-2015 real per capita GDP has grown more slowly in our state than for the United States generally, a record better only than Wisconsin’s. As a result, per capita GDP in Minnesota has declined, in real terms, from $4,658 above the level of the United States in 2014 to $239 in 2024.
Figure 1: GDP per capita in Minnesota minus GDP per capita for the United States, 2017$
I noted that:
Per capita economic growth comes from three sources. Growth in human capital, the quantity and quality of the labor provided; growth in physical capital, the tools those workers have to use; and growth in Total Factor Productivity, which is the efficiency with which these factors are combined.
I went on to say that:
Economists use a method called “growth accounting” to break down the growth rate of per capita GDP into the portions arising from each of these three sources. This, in turn, requires the construction of estimates of human and physical capital. I performed this exercise for the 50 states going back to 2008 in my report “Accounting for Growth: Measuring the sources of per capita economic growth at the state level” and the results are available as the American Experiment United States Tables.
This year, I have updated the estimates of physical capital stocks by state to cover 2024. I have also been working on updating the estimates of human capital stocks as the neccessary data become available, first for the “raw labor” components, employment and average hours worked annually, and then for the “knowledge capital” components, first the skills arising from experience and, finally, the skills arising from education.
Education
We measure the per worker stock of human capital arising from education by dividing the workforce into categories based on educational attainment, awarding each category a score which increases with the level of attainment, multiplying that by the number of workers in each category, then summing the totals for all categories. We then divide this total stock by the number of workers for the per worker number (eEduc). It follows that if the composition of the workforce by educational attainment changes, so will the stock of human capital arising from education per worker.
It is true that there are many workers without college degrees with more economically useful skills than many holders of PhDs. Nevertheless, on average, economists have found that each year of schooling tends to raise a worker’s wage by a certain percentage, reflecting increased skills.
The results of this exercise for 2024 are shown in Figure 1. We see that Minnesota ranks 12th out of 50 states for the human capital per worker arising from education.
Figure 1: Human capital per worker arising from education, 2024
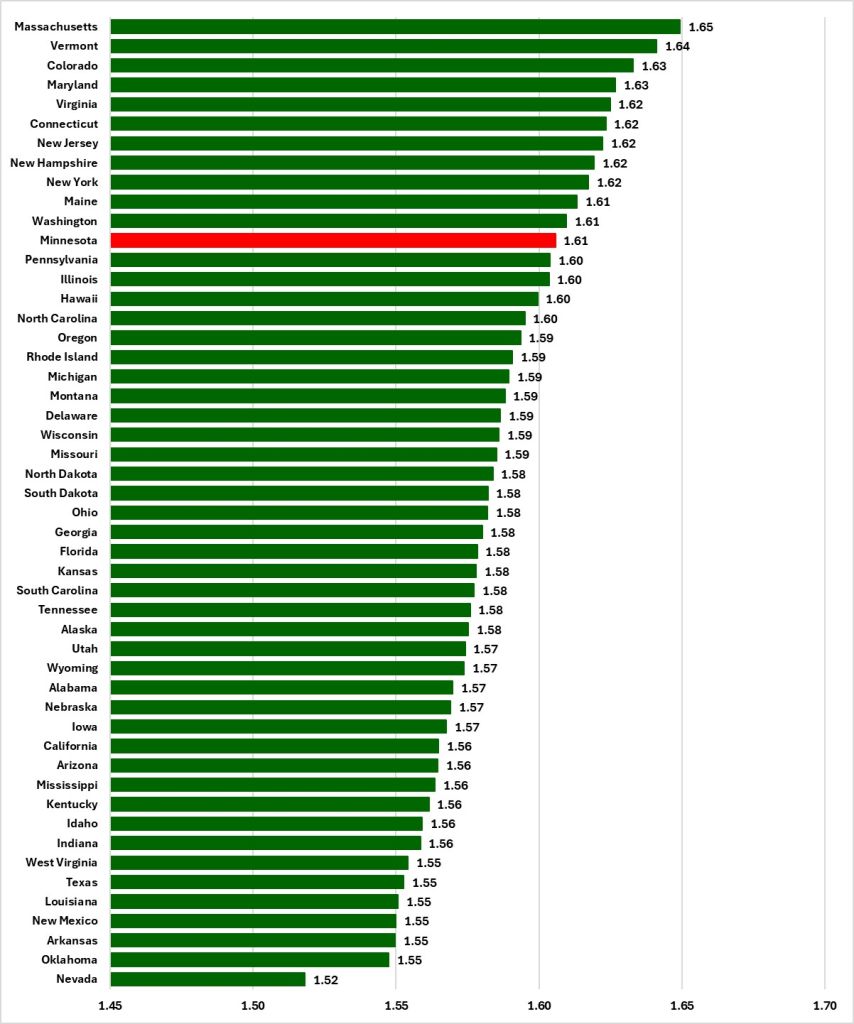
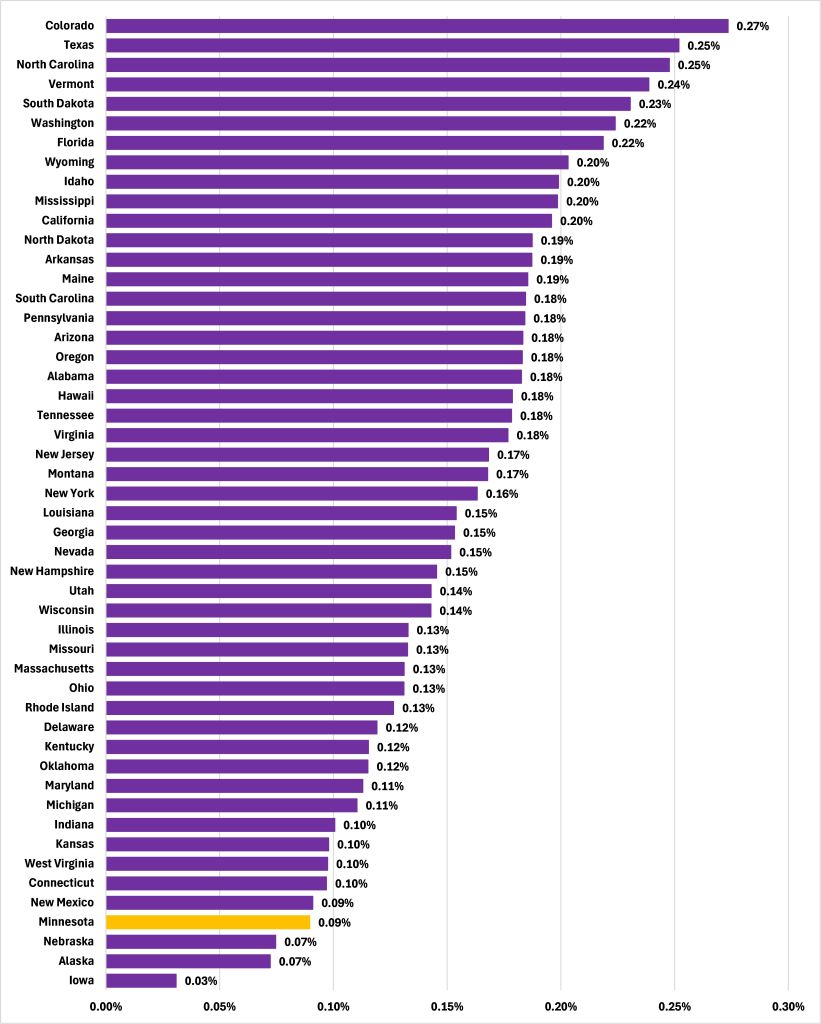
Figure 2 shows us how this has changed over the last decade. Here, we see that the average skills each worker had arising from education increased in Minnesota at a rate faster than in only three other states. So, while our level might be relatively impressive, our rate of growth is much less so, a story similar to that for our per capita GDP.
Figure 2: Average annual growth rate of human capital per worker arising from education, 2014-2015 to 2023-2024
What explains this? That will be covered in a report in the New Year, where I use growth accounting and our estimates of human and physical capital to take a deep dive into Minnesota’s per capita GDP growth. Watch this space.