
Yesterday, I wrote about Minnesota’s performance on the raw labor components of human capital; the number of people employed and the average number of hours each of them works annually. But I concluded that:
This is only half of the story with human capital growth and, perhaps, not the most interesting half. Both of these sources of human capital and GDP growth are subject to limits. Once everyone is working there can be no more growth derived from boosting the employment ratio, a situation Minnesota might be close to now. Once everyone is working all the hours God sends, there can be no further human capital or GDP growth from that source either, but who wants that?
For sustainable growth from human capital, we need to look to knowledge capital, the skills arising from education and experience.
In my report “Accounting for Growth: Measuring the sources of per capita economic growth at the state level,” I constructed estimates of the human capital per worker arising from education and experience going back to 2008. The data are now available to allow me to update my estimates of the human capital per worker arising from experience for 2024.
Experience
I estimate the human capital per worker arising from experience (hExp) using data from the Bureau of Labor Statistics (BLS) which breaks down each state’s labor force by age. I calculate the percentage in each age category and apply that to the number of people employed in each state (E) which the BLS also provides.
Next, I award each group (j) a score (xj) shown in Table 1.
Table 1: Scores for experience per worker
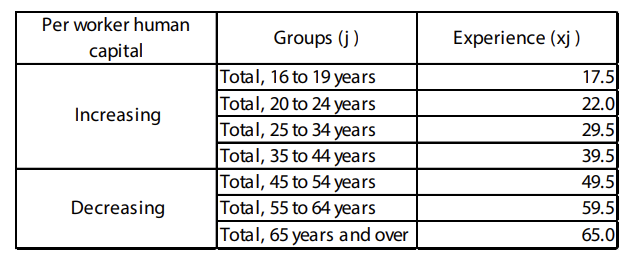
I can calculate the per worker human capital arising from experience in each age group with the equation:

The negative coefficient on the squared term means that the return on experience declines as people age; they become “set in their ways,” so to speak, and experience becomes a negative.
Finally, I multiply this by the number of people in each age category, then sum those totals for all age categories to get the total human capital arising from experience in each state in each year (EXP) which I then divide by the number of people employed (E) for the per worker number (hExp). There are equations for this, too, but I’ll spare you those for now.
The results of this exercise for 2024 are shown in Figure 1. We see that Minnesota ranks 18th out of 50 states for the human capital per worker arising from education.
Figure 1: Human capital per worker arising from experience, 2024
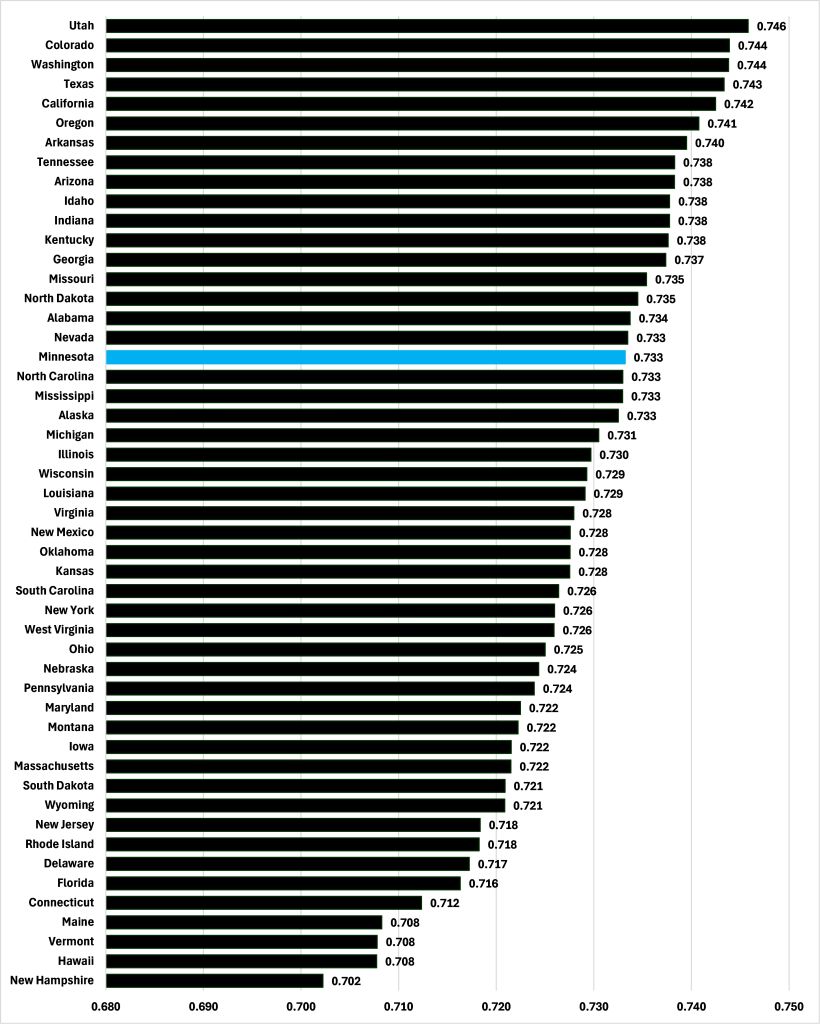
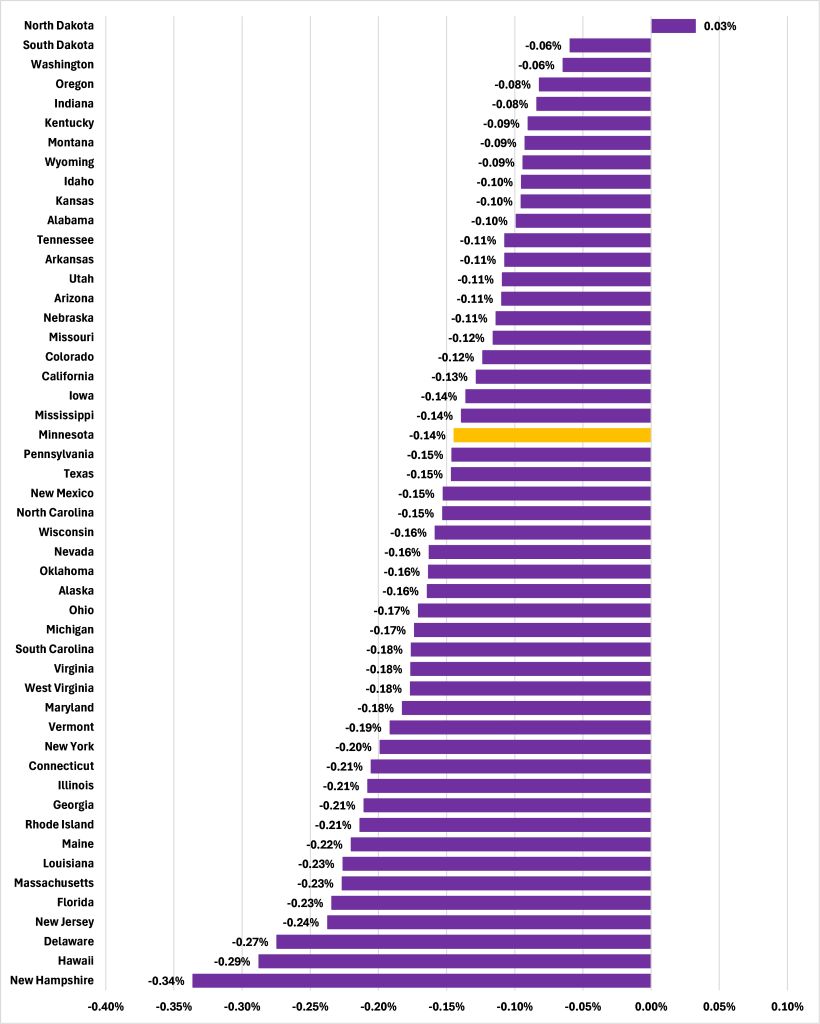
Figure 2 shows us how this has changed over the last decade. Only North Dakota saw any increase in human capital and, consequently, Gross Domestic Product (GDP) from this source over this period. In Minnesota, our level of per worker human capital arising from experience declined at an average annual rate of -0.1%, worse than in 21 out of 50 states, but, by the same token, better than in 28.
Figure 2: Average annual growth rate of human capital per worker arising from education, 2014-2015 to 2023-2024
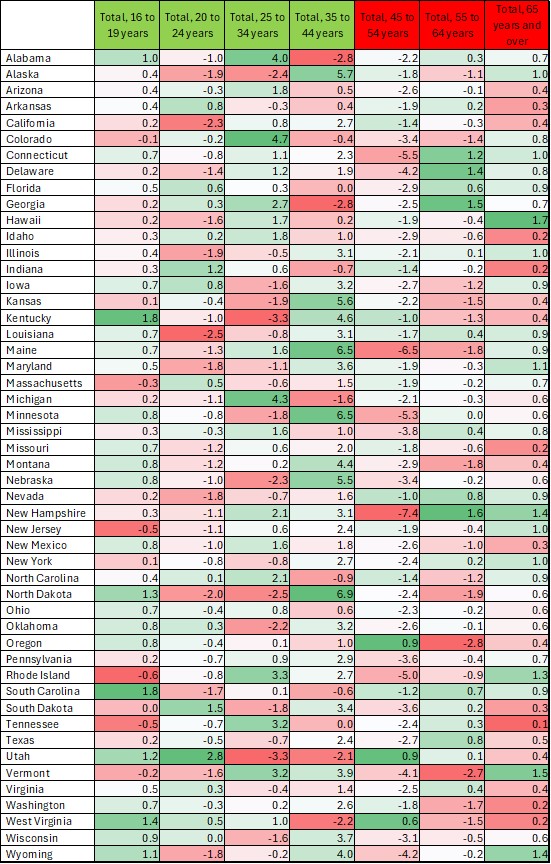
What explains this? The result of the equation above is that the per worker level of human capital rises as you move up through the age categories until you reach “Total, 35 to 44 years,” after which it declines. So, as states see their populations age, we would expect to see, beyond a point, the average per worker level of human capital arising from experience per worker decline.
Table 2 illustrates that. From 2014 to 2024, North Dakota scored the biggest increase in the share of its workforce between 35 and 44, the peak years for human capital arising from experience, which drove that first place finish. New Hampshire, on the other hand, scored dead last in the “Total, 45 to 54 years” category and first and third in the two above that, which explains its placing at the bottom. Minnesota did well here, coming second only to North Dakota in the share of its workforce in the “Total, 35 to 44” years category.
Table 2: Percentage point growth in share of workforce, 2014 to 2024
This is one half of our “knowledge capital” element of human capital. The other half is the human capital arising from education. Sadly, the data I need for that is produced by the Census Bureau and was due out this month until the federal government shutdown hit. Watch this space, I guess.