
When Gov. Walz announced that he was ending his campaign for reelection, local media began to assess his legacy. The Minnesota Reformer carried an article titled “Gov. Tim Walz’s Minnesota in 8 charts.” The economic metrics were not favorable — Minnesota GDP grew slower than national GDP, Unemployment is rising after a 2022 recovery — except for one — Minnesota wages remained highest in the Midwest.
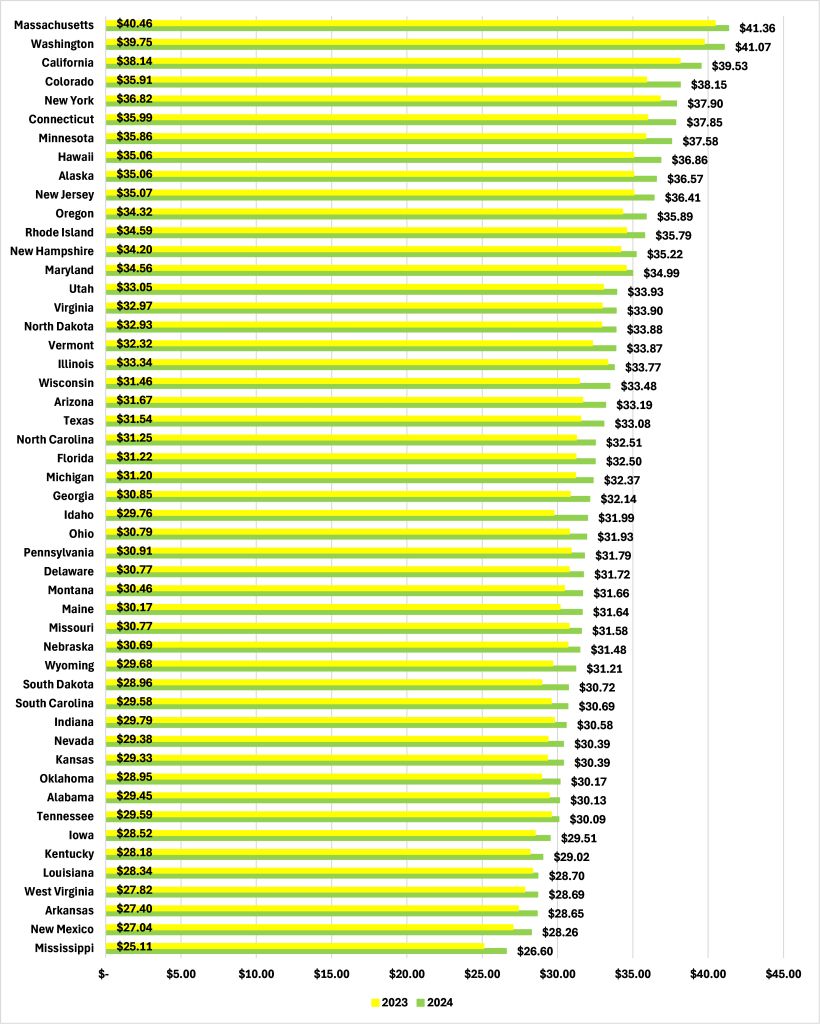
Nominally, this is true. Depending on how you define the “midwest” — I’ll go with the Bureau of Labor Statistics’ (BLS) definition — our state does have the highest wages, as Figure 1, using BLS data, shows. In 2024, average hourly earnings in Minnesota were $37.58, above those of Illinois, Indiana, Iowa ($29.51), Kansas, Michigan, Missouri, Nebraska, North Dakota ($33.88), Ohio, South Dakota ($30.72), or Wisconsin ($33.48).
Figure 1: Average hourly earnings
But it is also true that, just as wages vary widely across the United States, so does the cost of living. A high nominal wage in one place might buy you less than a lower nominal wage would somewhere else.
To capture this, the Bureau of Economic Analysis (BEA) produces Regional Price Parities (RPP) which measure:
…the differences in price levels across states and metropolitan areas for a given year and are expressed as a percentage of the overall national price level.
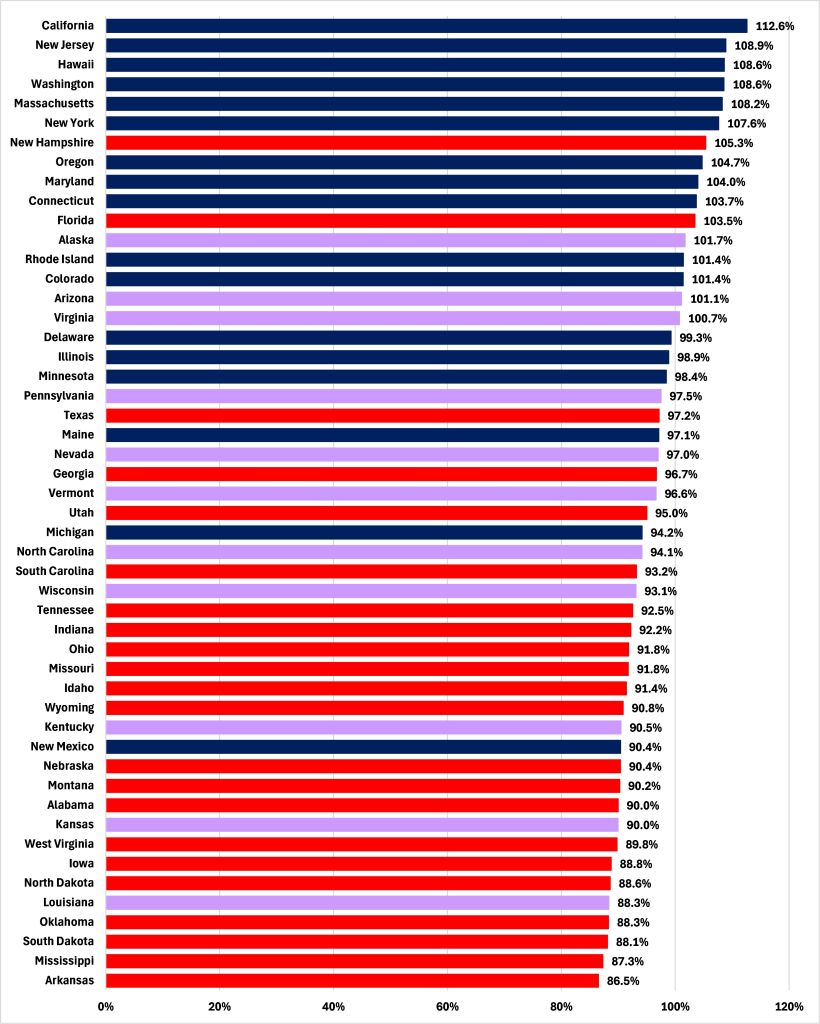
Figure 2 shows that in 2023 — the most recent year for which RPPs are available — the price level in Minnesota was 98.4% that of the United States generally while, in North Dakota, it was just 88.6% of it. Interestingly, perhaps, states with Democratic trifectas (highlighted in blue) tend to be relatively more expensive than those with Republican trifectas (highlighted in red); nine of the ten least affordable states have Democratic trifectas while sixteen of the twenty most affordable states had Republican ones.
Figure 2: Regional Price Parities, 2023
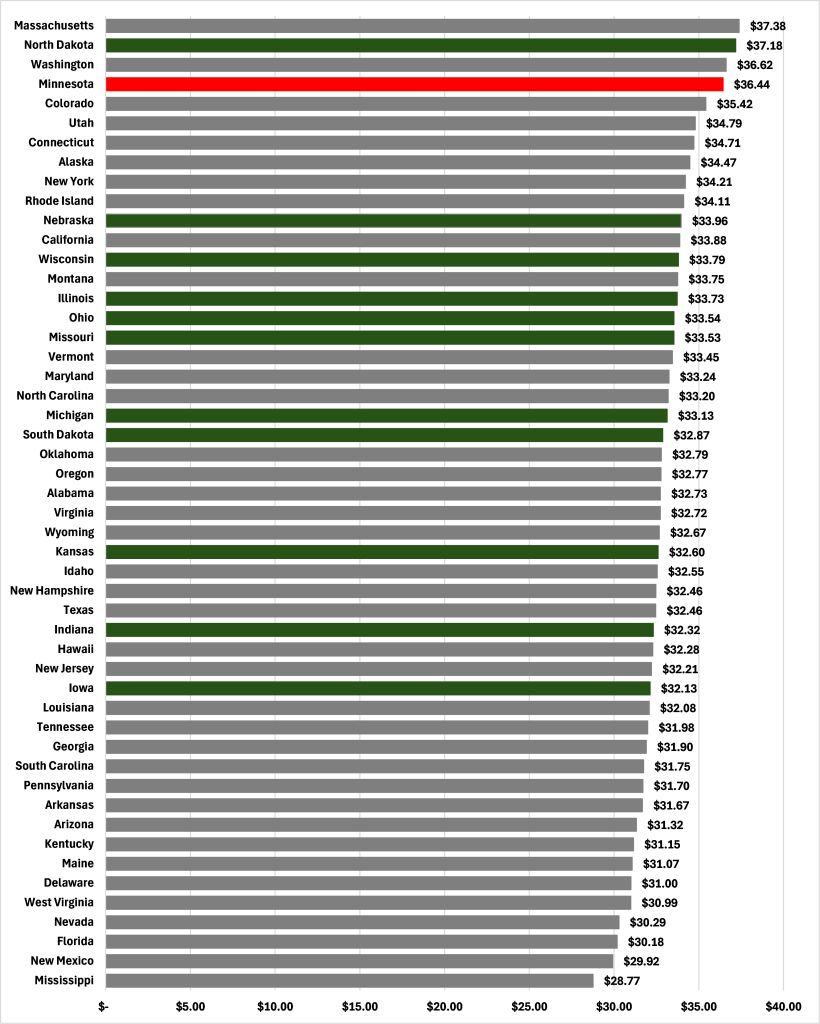
We can use these RPPs to adjust a nominal wage, such as those for 2023 shown in Figure 1, to reflect its purchasing power, or the “real” wage. Figure 3 shows that, when we do this adjustment for cost-of-living differences, Minnesota’s wage bumps up a bit from 7th out of 50 states to 4th but also that North Dakota’s soars from 18th to 2nd and that, in 2023, the real wage in the Peace Garden State was higher than that in the Gopher State.
Figure 3: Real wage, 2023
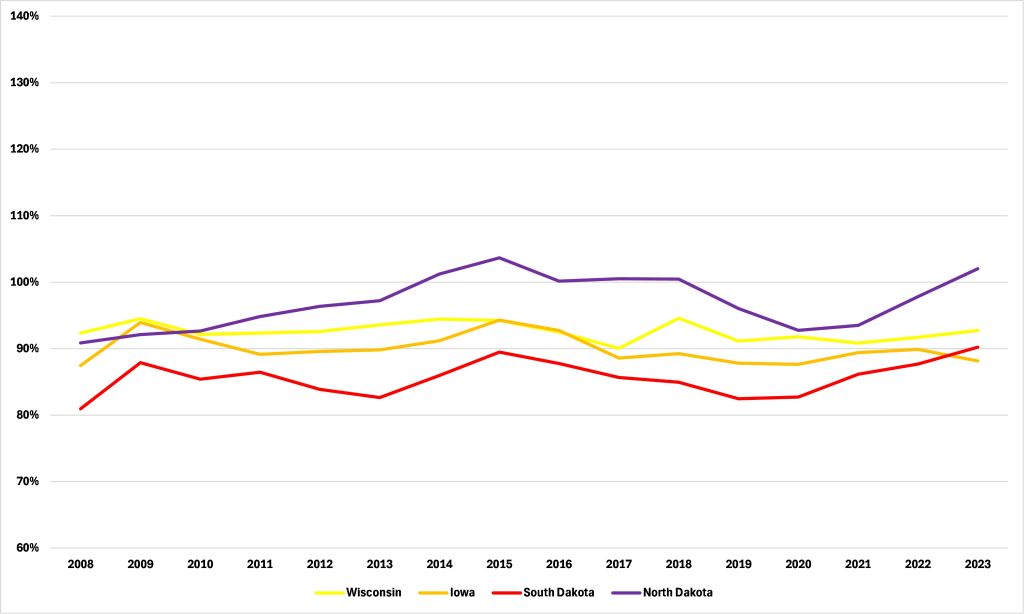
This is not unheard of. As Figure 4 shows, between 2014 and 2018, the real wage in North Dakota was higher than in Minnesota. It began falling, relatively, after that, before bouncing back from 2021 to overtake its eastern neighbor once again. Also of interest is that South Dakota’s real wage has gone from 81.0% of Minnesota’s in 2008 to 90.2% in 2023, with a pick up since 2020, while Iowa and Wisconsin have shown little, if any, relative improvement. The Dakotas are where the growth is, certainly in the years since 2020.
Figure 4: Real wage as a share of Minnesota’s
I have seen it suggested that numbers such as those shown in Figure 2 reflect that fact that people want to live in “blue” states and not “red” ones. The data do not bear this out. As I wrote in November, in 2024 “Blue America lost 360.3 people per 100,000 residents in 2024 while Red America gained 263.9.” Blue states are relatively expensive, in other words, even while they are haemorraging residents to red states. As I note in the current edition of our magazine, Thinking Minnesota, “blue states have an affordability problem.”