
Yesterday, I wrote that “Per capita economic growth comes from three sources,” one of which is “Growth in human capital, the quantity and quality of the labor provided.” I also noted that, in my report “Accounting for Growth: Measuring the sources of per capita economic growth at the state level,” I had constructed estimates of human capital for each of the 50 states going back to 2008 which are available as the American Experiment United States Tables.
Lets look into these a little further and update them for 2024.
Measuring human capital
Human capital has both quantitative and qualitative components.
The quantitative components are the number of people employed (E) and the average number of hours each of these workers works annually (hours). Taken together, these give you a measure of what might be called “raw labor.”
The qualitative components are the skills which augment each hour of raw labor. We call this “knowledge capital,” and it arises from either the education (eEduc) or the experience (eExp) of the average worker.
Multiplying all these together gives you the total stock of human capital in each state in each year (H) and dividing that by the population (N) gives you the per capita stock of human capital (h), as shown in this equation:
It follows, if you remember your high school math, that we can break down the growth rate in human capital per capita (gh) into the growth rates of its components using this equation:
This will allow us to calculate how much human capital growth comes from the growth of raw labor and how much comes from the growth of knowledge capital.
Raw labor
Data is now available to allow me to update the estimates of the human capital arising from raw labor to include 2024.
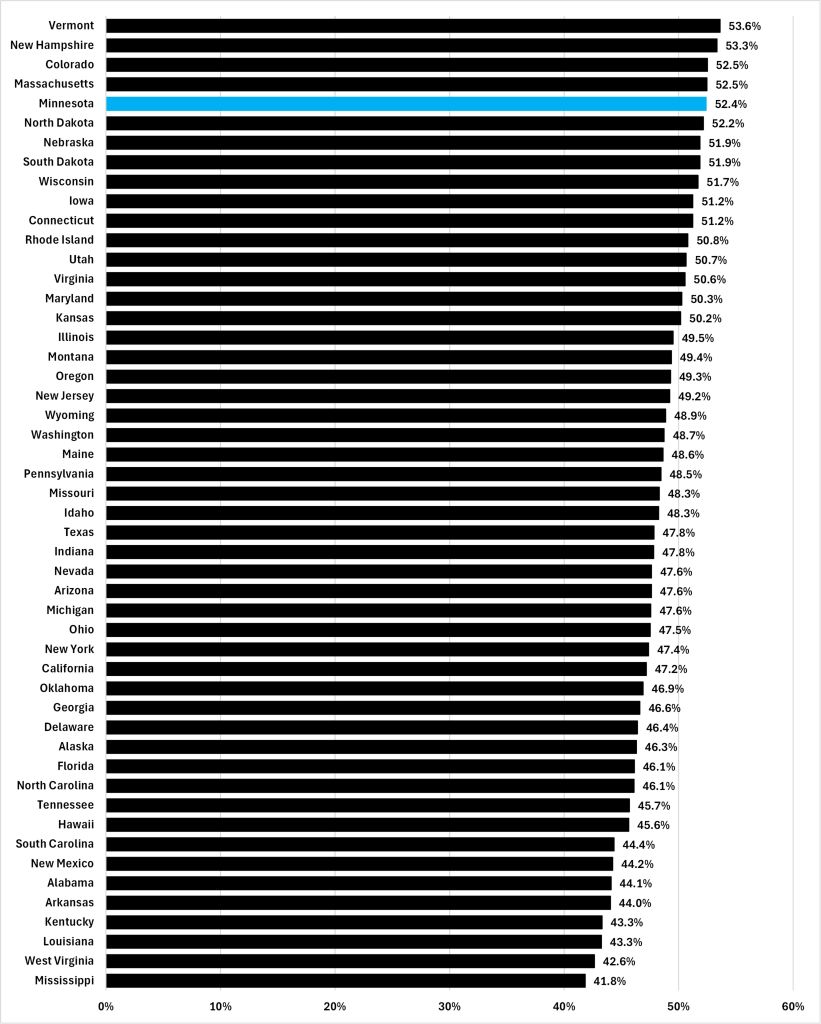
The Bureau of Labor Statistics (BLS) gives an estimate of the number of people employed in each state going back to 1976 (E). The Bureau of Economic Analysis gives an estimate of the population in each state going back to 1929 (N). Dividing the one by the other gives us the employment ratio (E/N) for 2024 shown in Figure 1. On this measure, Minnesota ranked fifth out of 50 states with a rate of 52.4%, an impressive score.
Figure 1: Employment ratio, 2024
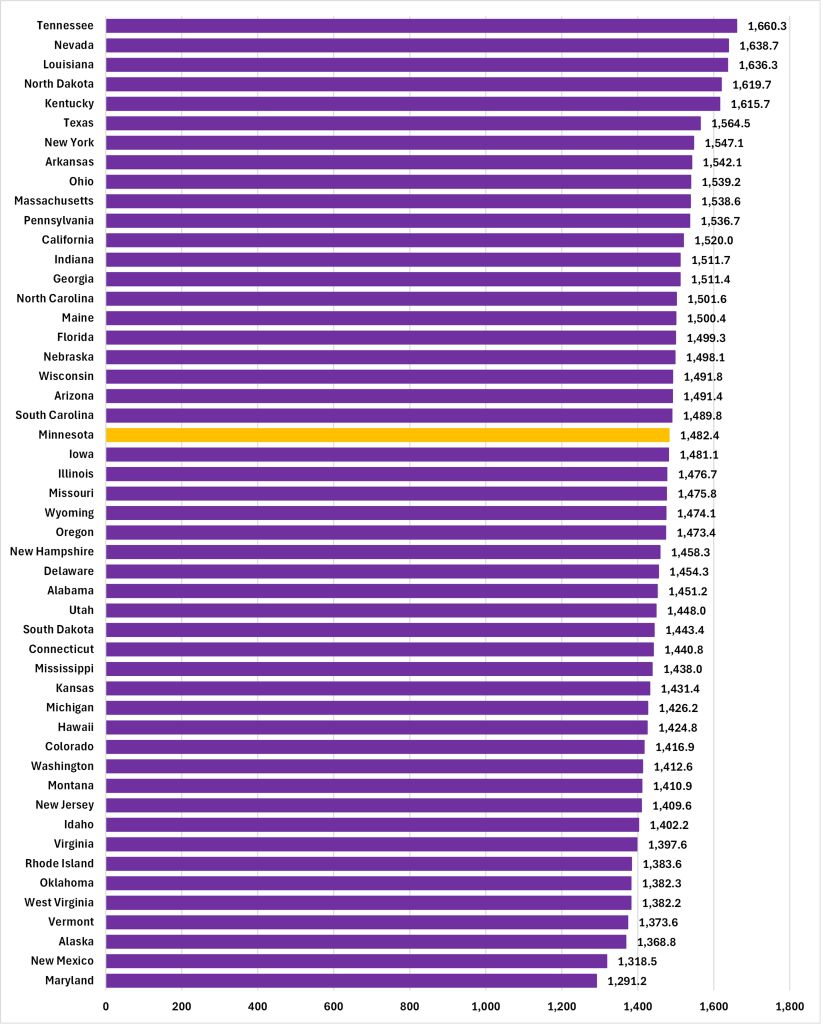
The BLS also gives us data on the total number of hours worked in each state (HOURS) going back to 2007 which we can divide by the number of people employed (E) to get the average number of hours each worker works (hours) shown in Figure 2. Here our state ranks 22nd out of 50 states, with the average Minnesotan working 1,482.4 hours annually. Obviously, we could work more hours like our neighbors in North Dakota and boost per capita GDP that way, but, given that economists generally see work as a “disutility,” lets look for other ways of doing it instead.
Figure 2: Average hours worked, 2024
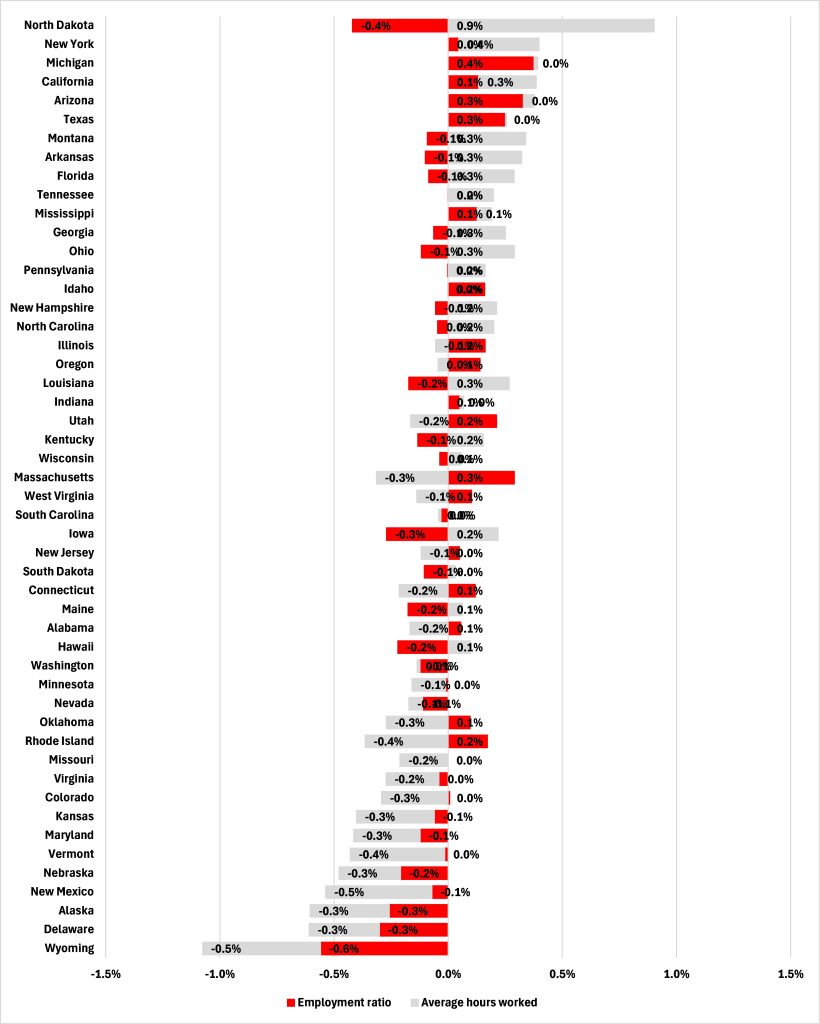
With these estimates going back to 2008, we can calculate the annual growth rates and the average growth rate over a number of years for both of these components of raw labor. We can then, as equation 2 shows, sum these average growth rates to get the total growth rate of raw labor shown in Figure 3. We see, for example, that in North Dakota, the raw labor component of human capital fell at an average rate of -0.5% from 2014 to 2024. This was because, while average hours worked increased by 0.9% annually, on average, the employment ratio fell by -0.4%, on average. In Minnesota, the employment ratio didn’t change, on average, so raw labor declined at the -0.1% average annual rate at which the average hours worked declined.
Figure 3: Average annual growth rate of raw labor, 2014-2015 to 2023-2024
This is only half of the story with human capital growth and, perhaps, not the most interesting half. Both of these sources of human capital and GDP growth are subject to limits. Once everyone is working there can be no more growth derived from boosting the employment ratio, a situation Minnesota might be close to now. Once everyone is working all the hours God sends, there can be no further human capital or GDP growth from that source either, but who wants that?
For sustainable growth from human capital, we need to look to knowledge capital, the skills arising from education and experience.