
Massachusetts has a large share of young adults in its population. In descending order, the Commonwealth’s largest age demographics are 30 to 34, 20 to 24, and 35 to 39 according to US DataLabs.
One reason why the share of individuals in those age groups is larger is because the proportion of younger age groups is unusually smaller than average. Some have argued that this is due to affordability and because the state’s notable universities attract many young adults. These data mean that much of the Massachusetts population is in the workforce’s age range (20-to–39 year olds), which is one reason for Massachusetts’s consistently above-average employment rates.
Another factor behind Massachusetts’s high labor participation is the Commonwealth’s highly educated workers. The Commonwealth has the nation’s highest percentage of workers who have bachelor’s degrees or higher.
However, although Massachusetts’ labor force participation is among the highest in the country, its youth population is dwindling. In fact, five of the six New England states have among have the nation’s lowest rates of individuals aged 10 to 14, according to US DataLabs. This could have negative impacts as the baby boomer generation reaches retirement age and there are not enough young people to replace them. This may also lead to a shortage of skilled workers, particularly in the state’s important and renowned STEM industries.
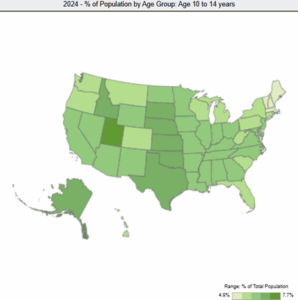
Figure 1: Map of United States % of population by age group 10 to 14 years old. Data from Pioneer’s US DataLabs.
The number of births has steadily declined over the past decade, falling by 25 percent from 1990 to 2024. To put this in perspective, in the early 2000s Massachusetts had a net natural population increase of about 23,000 to 24,500 people each year, while from 2020 to 2024 it was about 18,267, with 6,718 in 2024 (0.26 percent). Furthermore, US DataLabs shows Massachusetts has a negative rate of domestic migration, meaning more people are leaving the state than coming in.
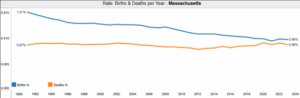
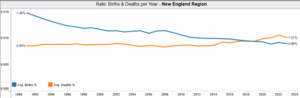
Figure 2: The rate of births and deaths (net natural population) per year in Massachusetts and New England from 1990 to 2024. Data from Pioneer’s US DataLabs.
All of New England, not just Massachusetts, has seen a shift towards negative net natural population growth, meaning New England states are far more reliant on attracting out-of-staters and immigrants to maintain population levels.
In 2023 Massachusetts ranked 26th among the states in rate of net natural change (births minus deaths, not including migration) at 0.10 percent. Utah had the highest rate of change at 0.73 percent and West Virigina the lowest at -0.49 percent.
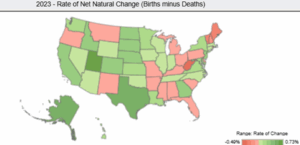
Figure 3: Rate of net natural change (births minus deaths) across the US in 2023. Data from Pioneer’s US DataLabs.,
Economists have reported concerns about the “declining labor force and shrinking working age population” in Massachusetts. The combination of declining natural population growth, increased out–migration (an estimated 162,751 people from April 2020 to July 2024), and the baby boomer generation reaching retirement age raises concerns about future workforce shortages, slower economic growth, and a shrinking tax base to support public services.
International migration has been significant in Massachusetts, often offsetting population losses from domestic migration, but federal policy changes could alter the population growth it offers. Unless the Commonwealth takes meaningful action towards retaining residents, through initiatives such as encouraging business formation and growth, incentivizing new housing development, and maintaining a quality education system, the long-term impact of a shrinking youth population could reshape the future workforce, economic development, and the exceptionalist character of Massachusetts.
Erin Moran is a Roger Perry Government Transparency Intern with the Pioneer Institute. She is a rising senior at College of the Holy Cross, majoring in Political Science. Feel free to contact via LinkedIn.
\n\n\n\n \n


