
Yesterday, I looked at why Gross Domestic Product (GDP) per capita growth in Minnesota has ranked 38th out of 50 states since 2014. Using the framework and data from our recent report “Accounting for Growth: Measuring the sources of per capita economic growth at the state level,” which “broke down the growth rate of per capita GDP into its components; the per capita growth rate in human capital, physical capital, and Total Factor Productivity,” I found that:
Minnesota’s average annual rate of per capita human capital growth between 2014 and 2023 ranked 42nd out of 50 states. This was driven by low rankings for the growth of the employment/population ratio (43rd out of 50 states), and the per worker skills arising from education (42nd) and experience (45th).
Employment
In October, I summarized how we assemble our estimates of human capital per capita at the state level.
Human capital has both quantitative and qualitative components.
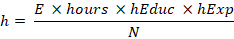
The quantitative components are the number of people employed (E) and the average number of hours each of these workers works annually (hours). Taken together, these give you a measure of what might be called “raw labor.”
The qualitative components are the skills which augment each hour of raw labor. We call this “knowledge capital,” and it arises from either the education (hEduc) or the experience (hExp) of the average worker.
Multiplying all these together gives you the total stock of human capital in each state in each year (H) and dividing that by the population (N) gives you the per capita stock of human capital (h), as shown in this equation:
It follows, if you remember your high school math, that we can break down the growth rate in human capital per capita (gh) into the growth rates of its components using this equation:

This will allow us to calculate how much human capital growth comes from the growth of raw labor and how much comes from the growth of knowledge capital.
Updating my estimates for 2024, for its share of the population employed (E/N) “Minnesota ranked fifth out of 50 states with a rate of 52.4%, an impressive score.” But, in 2014, it ranked fourth. This is not to ring an alarm bell — we’ve dropped one spot and are still fifth — but it is to say that the scope for our state to grow its economy by increasing the share of the population employed is probably bumping up against some limit and it already was in 2014. The slow growth of this element of human capital in the period since 2014 should not be a surprise.
Immigration
While increasing the share of given population working can be expected to increase GDP per capita, the same is not necessarily true for increasing the number of people working via immigration.
In our 2021 report “The State of Minnesota’s Economy: 2020: A focus on economic growth,” I noted that:
Whether a policy which increases the population, such as expanding immigration, leads to higher per capita incomes depends on two things.
The first is whether the new arrivals have an employment ratio at least as high as that of the population already here. If they do not, they actually will lower the employment ratio, exacerbating the very problem the policy is intended to solve…
The second is whether the new arrivals are at least as productive as the workers already resident. Considering GDP per capita, immigrant workers add to the denominator (population) as well as the numerator (GDP). If these workers increase the population by a greater percentage than they increase GDP, they will actually lower GDP per capita.
What matters is the [relative] skill level of the workers…
In any discussion of immigration as a tool to increase the growth rate of per capita GDP, these questions need to be borne in mind.