In our report “The State of Minnesota’s Economy: 2020: A focus on economic growth,” we wrote that:
Per capita economic growth comes from three sources: an increase in the amount of labor provided by a given population (a higher employment rate/ratio or hours worked) [and the quality of that labor]; growth of capital per worker (the tools those workers have to work with); and Total Factor Productivity (TFP), also known as Technology, which is the way inputs to the production process are transformed into output.
To investigate these further, I produced the American Experiment United States Tables using methods set out in my report “Accounting for Growth: Measuring the sources of per capita economic growth at the state level.” These contain estimates for each state for each year from 2008 to 2023 of employment, average hours worked annually, the average human capital arising from education per worker, the average human capital arising from experience per worker – human capital – and physical capital. My intention is to update these annually as the neccessary data become available.
Last Friday saw the release by the Bureau of Economic Analysis of estimates of physical capital by industry in the United States. Apportioning these between the states using the method outlined in “Accounting for Growth,” I have been able to update the estimates of physical capital stock for the states for 2024. Dividing these by employment in each state gives me the per worker number. These will be available on the American Experiment United States Tables shortly.
For now, Figure 1 shows the 50 states ranked by their per worker stocks of physical capital for 2024. Delaware — where the per worker stock of physical capital grew by 3.9% from 2023 to 2024 — has replaced North Dakota — where it shrank by 0.8% — as the top ranked state. Minnesota maintained its ranking of 24th out of the 50 states and Mississippi slipped one place to bottom: There is scope fo the Magnolia State to boost economic growth even further if it can boost physical capital growth.
Figure 1: Physical capital per worker, 2024 (2017$)
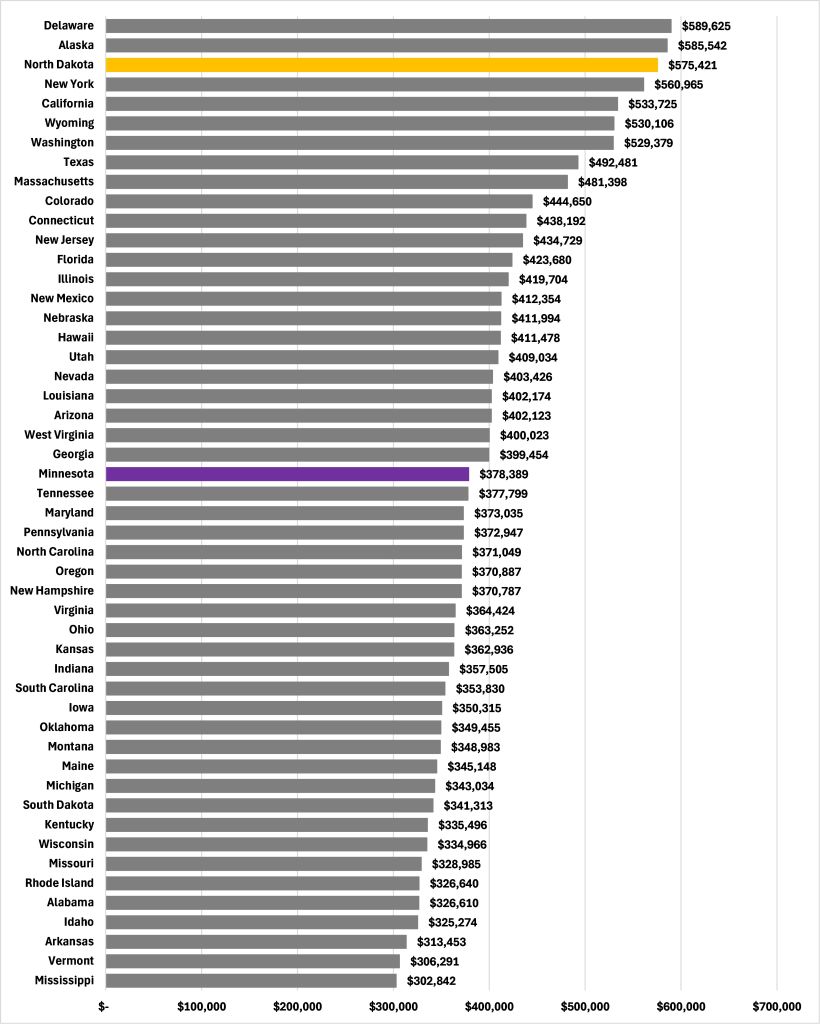
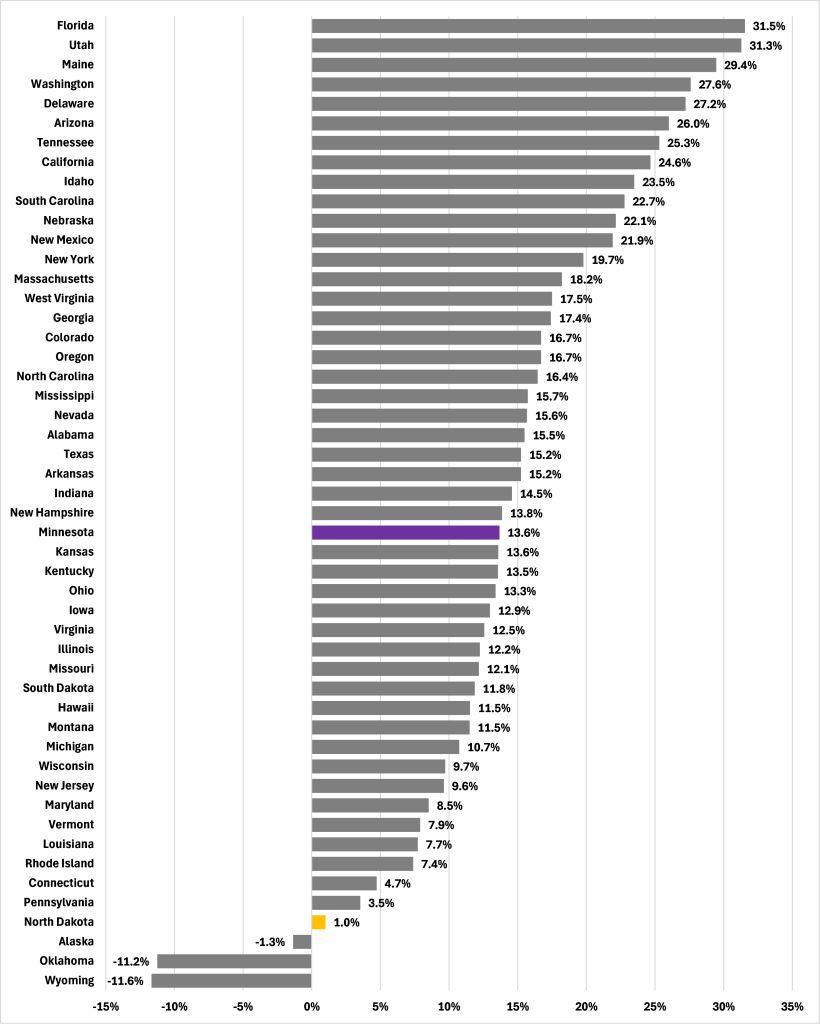
Figure 2 put this in broader context. In the last ten years, the per worker stock of physical capital has grown more quickly in Florida than anywhere else. In three states — Alaska, Oklahoma, and Wyoming — it has fallen, and North Dakota only just misses inclusion in this list. In Minnesota, it grew by 13.6%, a rate slower than in 26 states.
Figure 2: Real change in physical capital per worker, 2015 to 2024
These estimates will be available at the American Experiment United States Tables soon.