As Senate Democrats continue to refuse to pass a bill to reopen the federal government, SNAP has been much in the news; without a budget, there are no funds for the program.
SNAP stands for Supplemental Nutrition Assistance Program. Previously referred to as food stamps, it is, the Peterson Institute writes, “the largest federal program aimed at combating hunger and food insecurity among low-income Americans.” The program is administered by the Department of Agriculture which issues annual SNAP State Activity Reports, the most recent of which is from 2023.
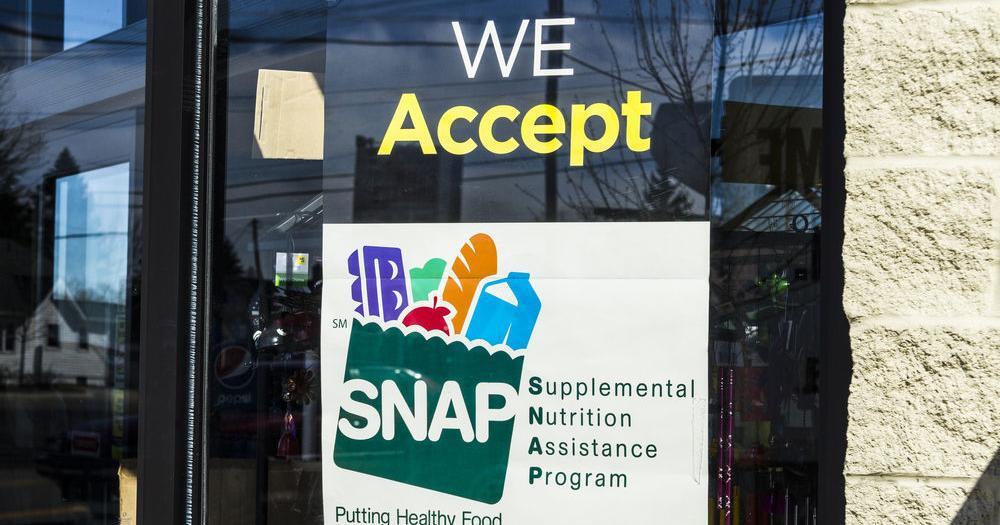
These reports show that, in 2018, SNAP issuance — the amount the federal government sends to states to finance the program — totaled $660.6 million (in 2023 dollars) in Minnesota. They also show that, by 2023, this had increased, in real terms, to $1.5 billion. This real terms increase of SNAP issuance in Minnesota of 128.2% between 2018 and 2023 was the largest among the 50 states, as Figure 1 shows.
Figure 1: Real change in SNAP issuance, 2018 to 2023
The total federal issuance covers both the benefits distributed to households and about 50% of the administrative costs of running the program. It follows that this total amount of SNAP issuance can change either because:
- the number of enrollees changes
- the amount which each enrollee receives changes
- administrative costs change
Enrollees
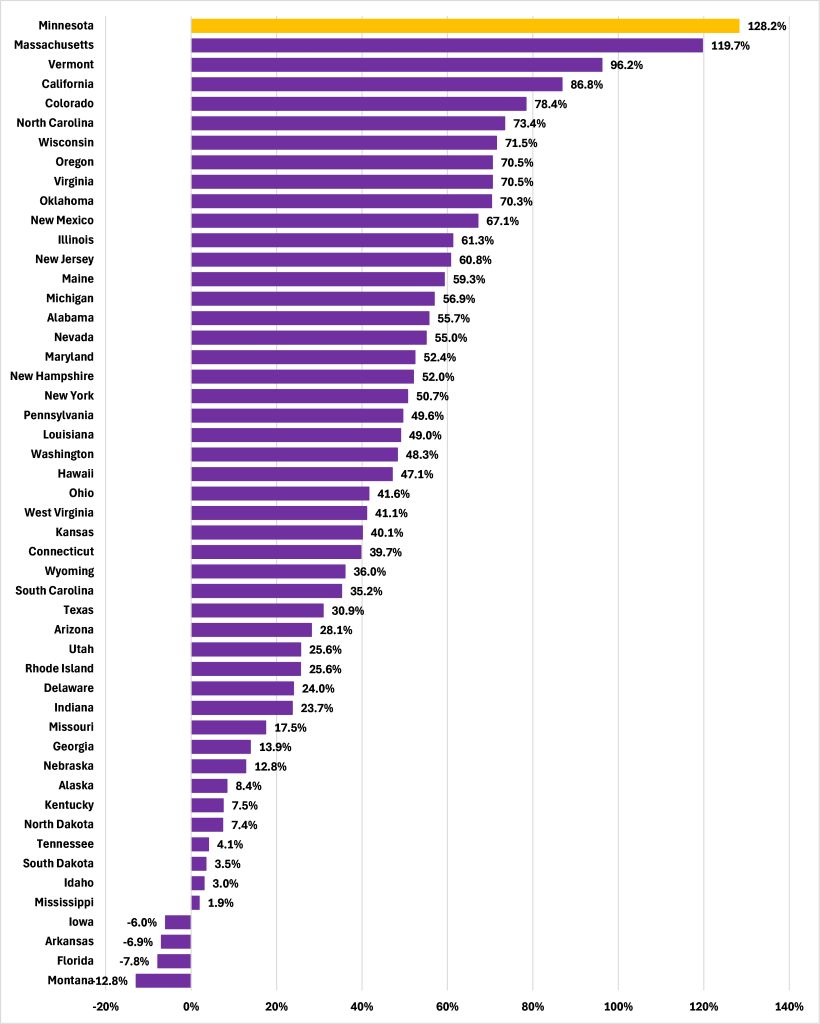
As Figure 2 shows, the increase in the number of households in Minnesota participating in the SNAP program from 2018 to 2023 — 10.8% — is higher than in 36 out of 50 states and well above the average of 3.6%. So, some portion of that nation-leading increase in SNAP issuance is attributable to an above average increase in the number of Minnesota households participating in the program.
Figure 2: Change in households participating, 2018 to 2023
Benefits
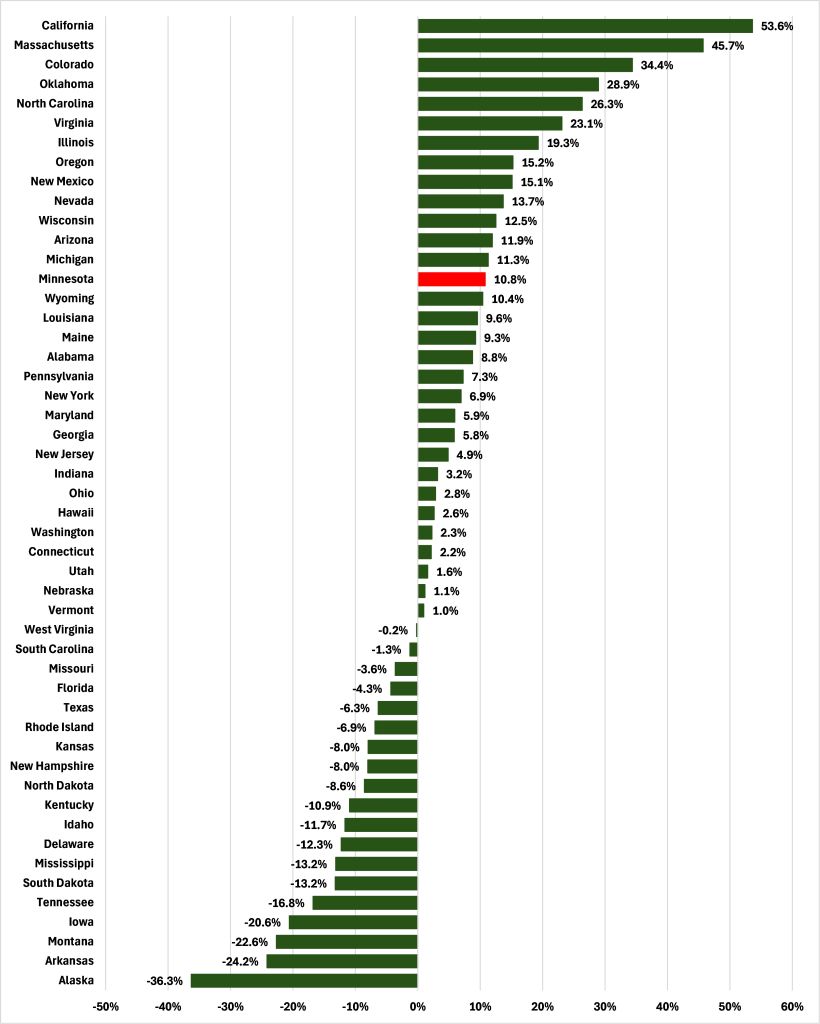
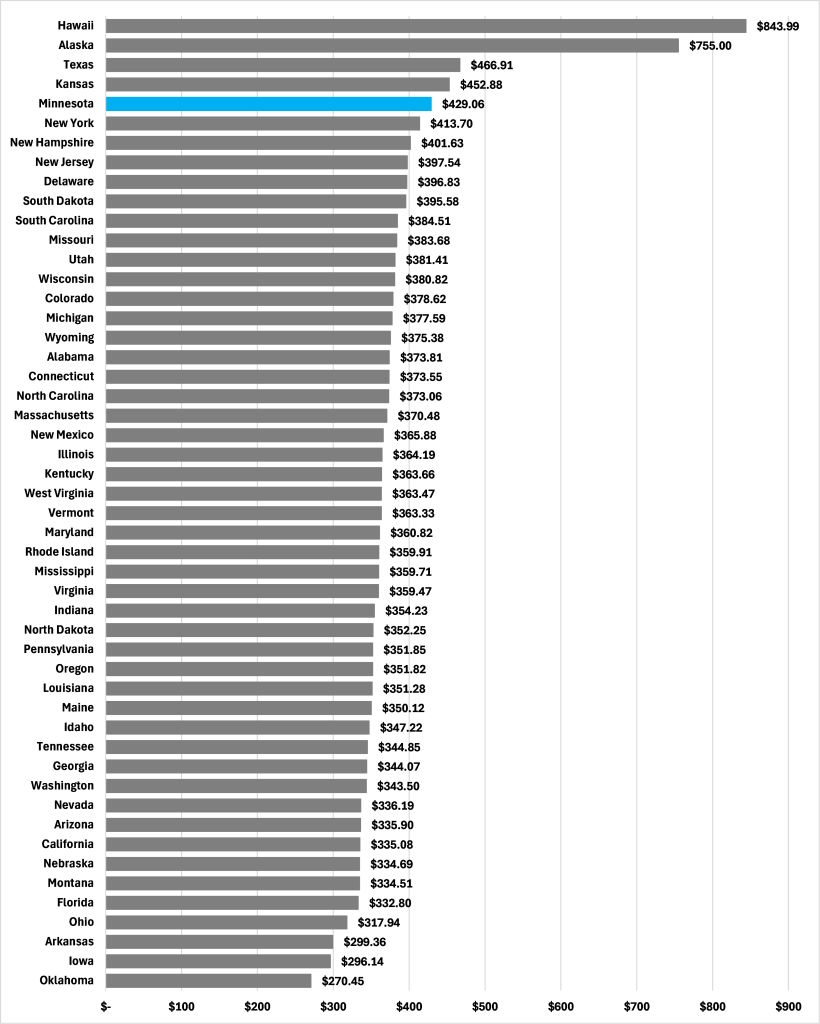
But that is not the whole story. As Figure 3 shows, the average monthly benefit received by each of these households rose, in real terms, by 65.5% in Minnesota between 2018 and 2023, an increase second only to that of New Hampshire. As a result, the average monthly SNAP benefit payout in Minnesota in 2023 — $429.06 — was higher than in 45 out of 50 states, as Figure 4 shows, and 17.3% above the national average.
Figure 3: Real change in average monthly benefit per household, 2018 to 2023
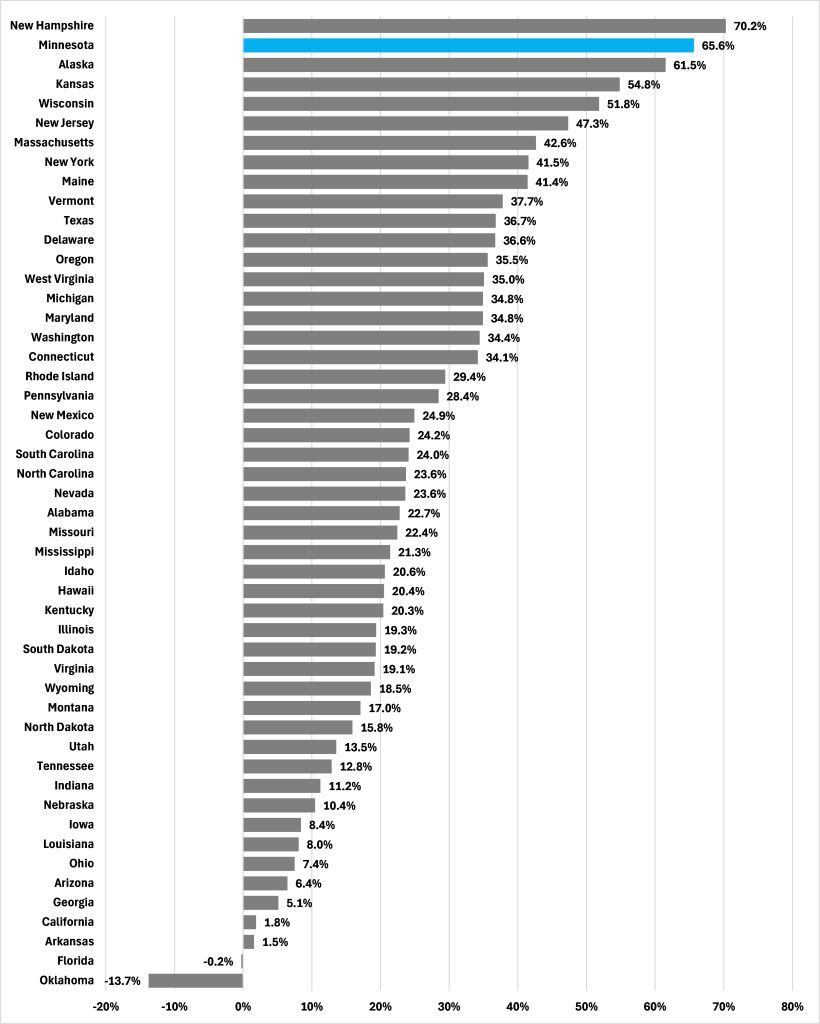
Figure 4: Average monthly SNAP benefit per household, 2023
Administration
Administrative costs have played less of a role in the increase in SNAP issuance in Minnesota between 2018 and 2023.
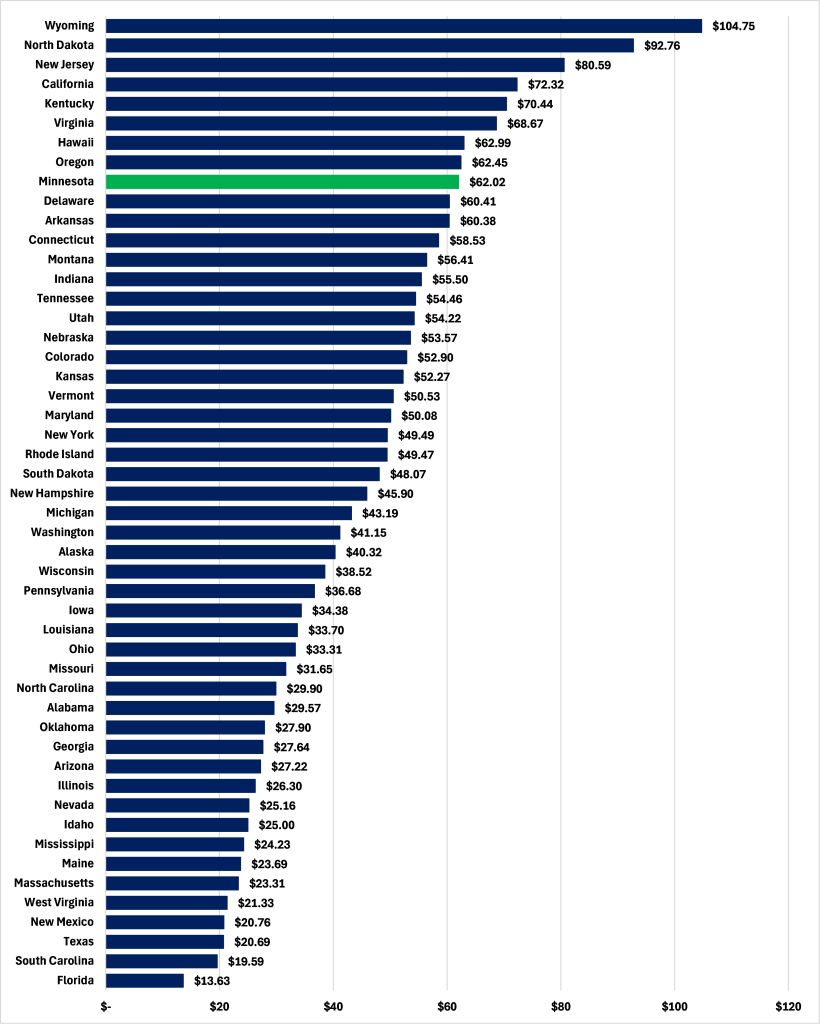
As Figure 5 shows, in real terms, the total monthly administration cost of each case in Minnesota fell by 2.5% between 2018 and 2023, from $63.60 (in 2023 dollars) to $62.02, a performance better than in 39 other states. But this largely reflects the fact that, in 2018, Minnesota was already spending more administering each case each month than 45 out of 50 states. Even after that decline from 2018 to 2023, Minnesota is spending more administering each SNAP case each month — $62.02 — than 41 other states, as Figure 6 shows, 49.0% above the national average.
Figure 5: Real change in monthly administrative costs per SNAP case, 2018 to 2023
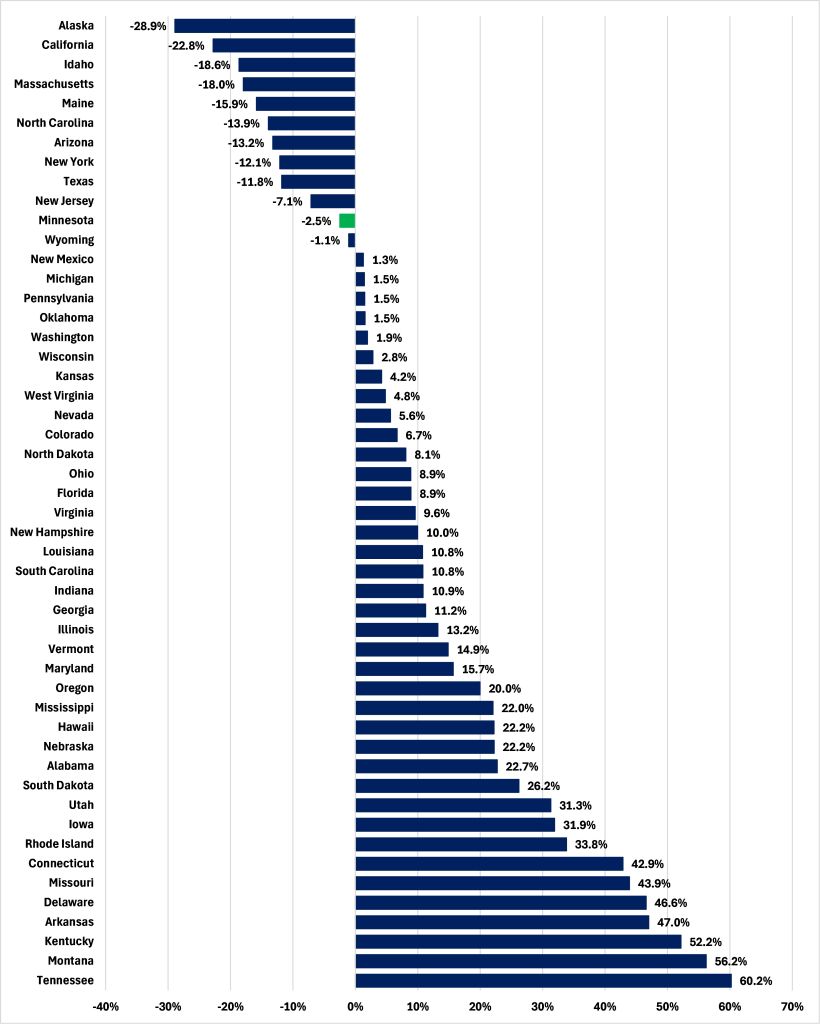
Figure 6: Average monthly administration cost per SNAP case, 2023
Conclusion
Minnesota’s nation-leading increase in SNAP Issuance between 2018 and 2023 is, then, the result of both an increase in the number of households covered greater than in 36 states and an increase in the average payout greater than in 48 states. This expansion of welfare says nothing positive about the state’s economy in these years.