

How has state government spending and revenue changed from 2017 to 2022?
Changes in revenue and spending can be a key indicator of state priorities for the size and scope of government, as well as a state’s overall health and economic output. Oftentimes revenue and expense growth tracks with the rate of inflation, as well as increases in wages and property values. However, state and local governments have generally grown larger overtime, having tripled inflation-adjusted spending from 1997 to 2021. State revenue and expenditures can also be impacted by variations in geography, demographics, history, and other external factors.
Growth of expenses
State’s expenses fluctuate over time. Changes to public services, growth in aid programs or entitlement benefits, and state emergencies – like with the Covid 19 pandemic – can all impact a state’s total expenses each year.
Figure 1: Percent Growth in Total State Expenditures Per Capita from 2017 to 2022. Data from Pioneer Institute’s US DataLabs.
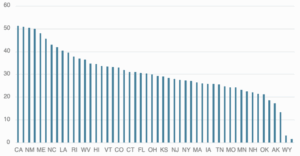
Part of the large increase in expenses over the six-years from 2017 to 2022 stems from the Covid-19 pandemic. Federal aid, combined with other state initiatives aimed at mitigating the effects of the pandemic, led to significant increases in state budgets and expenditures. For example, the CARES act provided California with $9.5 billion in aid and was combined with another $27 billion in federal aid aimed at replacing lost state revenue. Other states that significantly grew their per capita expenditures were Illinois (50.7 percent), New Mexico (50.2 percent), and Oregon (49.9 percent).
Even the slowest growing states still increased their per capita expenditures. They included Wyoming (3.05 percent), Montana (11.5 percent), Mississippi (13.4 percent), Alaska (17.2 percent) and North Dakota (18.6 percent). No state saw their expenditures decrease from 2017 to 2022.
Growth of Revenue
Like state expenses, revenue is determined by many factors. Taxes, federal aid, population size, inflation and stock market performance all influence a state’s revenue. In turn, revenue levels impact the size of a state’s budget and spending priorities.
Figure 2: Percent Growth in State Revenue Per Capita 2017-2022. Data from Pioneer Institute’s US Datalabs.
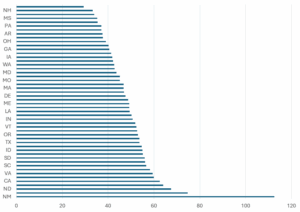
On average, states increased their revenue per capita from 2017 to 2022 by 49.6 percent. This comes in above the average increase in expenses (22.35 percent) and surpasses the inflation rate of 22 percent.
Conclusion
In summary, from 2017 to 2022 states saw increased costs, which were outweighed by higher revenues. Part of the increase in revenue can be attributed to the Covid-19 pandemic, where federal aid and funds were given to states and individuals to mitigate the adverse effects of the pandemic.
Oliver Dabora is a Roger Perry Government Transparency Intern with the Pioneer Institute. He is a rising senior at the Noble and Greenough School. Feel free to contact via LinkedIn or by writing a letter to Pioneer’s office.
\n\n\n\n \n


