Kansas Policy Institute (KPI) has released its latest A–F Grading of Kansas Schools, providing Kansans with a clear, easy-to-understand snapshot of academic performance statewide.
The A–F system translates complex state assessment data into familiar letter grades, offering a transparent alternative to Kansas’ official school report cards, which often rely on technical labels that are difficult for parents to interpret. The newly revamped website makes it quick and easy for families to find their school district and individual school buildings, giving users direct access to meaningful performance data.
Lowered Standards Cloud This Year’s Results
An important factor shaping the 2025–26 results is the recent reduction in state proficiency standards. As a result, many schools appear to show improvement, even when underlying academic performance has not materially changed.
This dynamic has been observed in previous years. Lowering expectations tends to produce artificial increases in reported performance, while maintaining higher standards provides a more accurate measure of student readiness. When Kansas returned to higher standards in 2015, 8th-grade reading proficiency dropped sharply from 85% to 30%, demonstrating how significantly results can shift based on how achievement is measured.
The current results should be interpreted with this context in mind. Apparent gains may reflect changes in measurement rather than meaningful improvements in student learning.
Performance Gaps Remain Significant
Even with lower proficiency standards, outcomes remain well below what many families might expect.
KPI’s A–F grades are based on state assessment results in English language arts and math across income groups and grade levels. Each component is equally weighted, similar to a student report card, to provide a consistent and transparent overall grade.
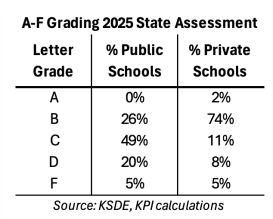 This year’s results show:
- Only one public school earned an “A”
- 26% of public schools earned a “B”
- 49% earned a “C”
- 20% received a “D”
- 5% earned an “F”
Private schools participating in state assessments performed significantly better:
- 2% earned an “A”
- 74% earned a “B”
- 11% earned a “C”
The data also continues to show wide variation in outcomes between schools, even among those with similar student populations and funding levels. These differences highlight that results are not determined solely by spending or demographics and point to the importance of identifying and replicating effective academic practices.
Transparency Drives Accountability
KPI’s A–F grading model is built on a simple premise: transparent, consistent measurement is essential to improving educational outcomes. The ultimate goal is not higher-looking scores, but higher levels of student achievement. When standards are lowered, it can create the illusion of progress without delivering real academic gains, masking challenges instead of addressing them. That approach leaves students behind academically and risks giving families a false sense of how well their children are truly prepared. Kansas students deserve honest assessments, higher expectations, and a system focused on real learning, because their success depends on accurate measurement and meaningful improvement.
Explore Kansas School Grades
Kansans can explore the full dataset, compare schools, and find their district or child’s school at: