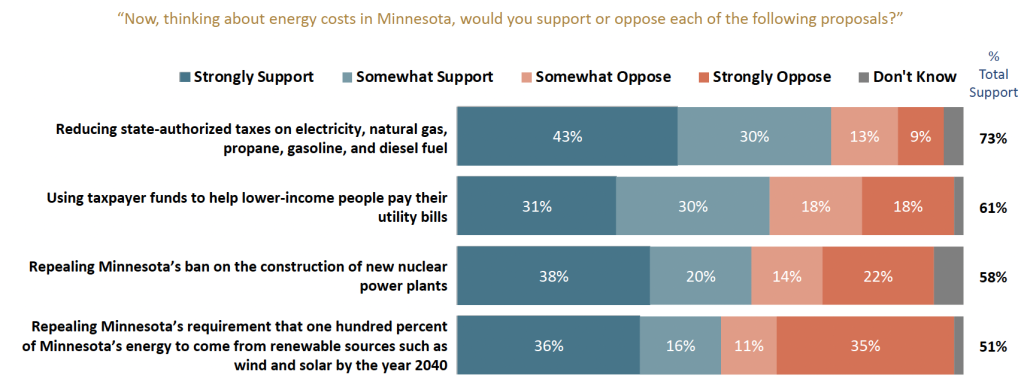
As I reported last week, energy affordability is a big issue for Minnesotan voters. This is according to the most recent Thinking Minnesota poll. Although the focus of concern is more so on gasoline and electricity, as per the graphic below, natural gas is also on the affordability radar. And it should be, given it has significantly, but quietly, been inflating.
Source: Meeting Street Insights
Prices
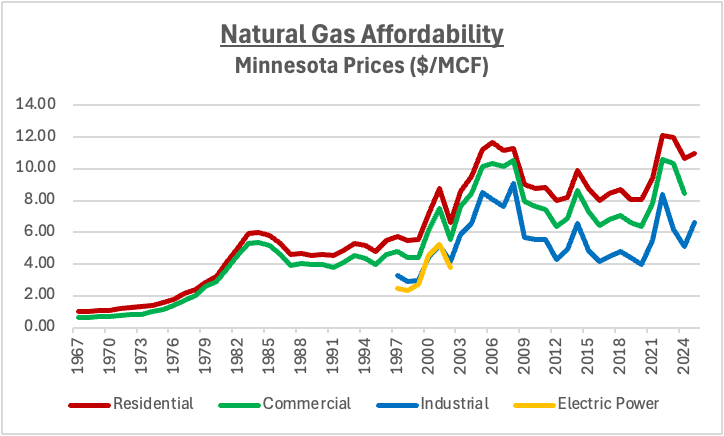
A few things that stand out in the first chart below of Minnesota natural gas (NG) prices are:
- Prices for all four major customer classes largely move up and down together over time. This is because NG is part of, not just a state or regional, but a national market.
- Prices were relatively flat in the 1980s and 1990s, but then largely took off since then. This is because the 80s and 90s were about economic growth not climate change.
- Residential prices are the highest followed by commercial, industrial and electric power. In 2024 for example, 10.65 residential, 8.46 commercial, and 5.10 industrial. Minnesota electric power prices are only available for 1997-2002 and 2008. The average was 4.32.
Source: Energy Information Administration
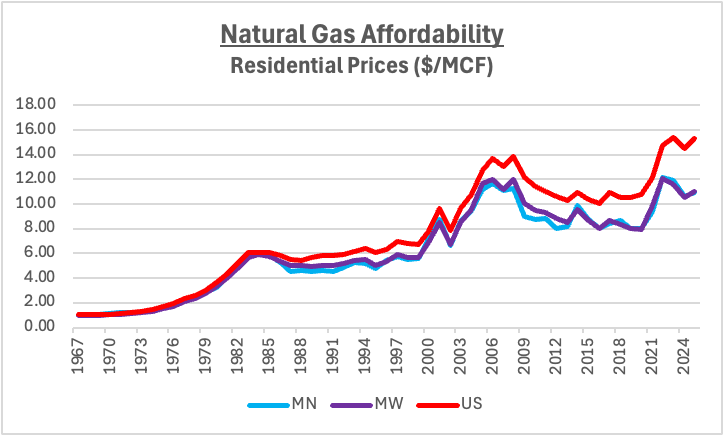
The second chart below compares NG residential prices (RP) in Minnesota to the Midwest (MW) and the nation (US). MW is comprised of: 1.) IL; 2.) IN; 3.) IA; 4.) MI; 5.) MN; 6.) NE; 7.) ND; 8.) OH; 9.) SD; and 10.) WI. Chart highlights include:
- In 2025, NGRP was lowest in MN at 10.98, compared to 11.06 in the MW and 15.34 in US.
- Thus, MW was only 0.7% higher than MN, but the US was a whopping 39.7% more.
- However, between 2002 and 2025, MN’s NGRP inflated by 66.1%, which was somewhat greater than the MW’s of 64.3%, yet thankfully far less than the nation’s 94.4%.
Source: Energy Information Administration
Uses
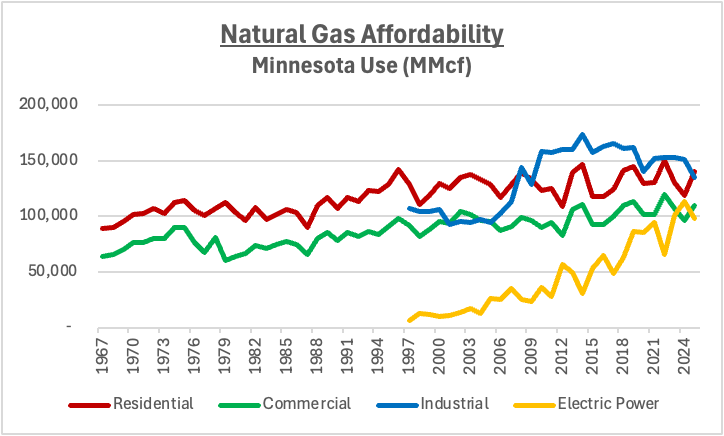
Affordability is as much about the quantity or use of energy as it is the price. Both are determined by market demand and supply, subject to government interventions. Regarding the latter, NG and electricity markets are intertwined and have both been increasingly impacted by renewable mandates and subsidies. As per the third chart below:
- Whilst residential and commercial NG use data for MN goes back to 1967, industrial and electric power (EP) data only starts in 1997.
- From 1997 to 2025, EP use skyrocketed by 1,507%, compared to 25.9% industrial, 18.8% commercial and 9% residential.
- NG use ratios (of 100%) went from 1.8% EP, 32.1% commercial, 27.6% commercial and 38.5% residential in 1997, to 20.3%, 28.0%, 22.7% and 29.1% respectively by 2025.
Source: Energy Information Administration
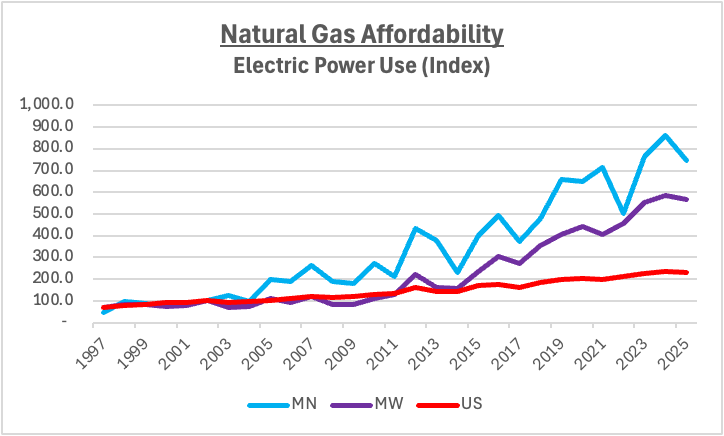
The fourth chart below shows EP use for MN, MW and US as an index, with 2002 as the base year set to 100. Indexes make readily apparent any change over time. Especially when there are large differences in scale, as is the case for NG use in a state compared to that in a region or nation. As per below, NGEP use for 1997 to 2025 grew:
- relatively modestly in the US nation, from 71.7 index points to 230.2, or by 221%;
- very robustly in the MW region, from 68.3 index points to 567.4, or by 731%;
- like gangbusters in the state of MN, from 46.4 index points to 745.8, or by 1,507%.
Source: Energy Information Administration
Affordability
The most supported policy proposal, from the polling graphic at the start of this article, suggests that the prime source of the problem of “energy costs in Minnesota” is “state-authorized taxes on electricity [and] natural gas” and, thus, the solution is “reducing” those. Such taxes, which only apply for half the year to residential customers, are relatively minor.
Relative, that is, compared to the major, but indirect, ‘tax’ of renewables on energy costs. Wind and solar mandates and subsidies directly inflate electricity prices and deflate electricity use. These also indirectly do the same in natural gas as use increasingly shifts to electric power generation, thus crowding out residential, commercial and industrial uses.
CleanTechnica recently wrote: “Low cost natural gas began pushing coal out of the power generation business in the early 2000’s.” As is typical with environmentalist narratives, this is a half-truth. The full truth is: A.) activist governments were behind “pushing coal out;” and B.) “low cost natural gas” was “low cost” relative to wind and solar, rather than to base-load coal.
Conclusion
Natural gas prices have been inflating in the 21st century, because it has had to increasingly carry the load (base and peak) for reliable electricity generation, whilst coal was being pushed out and off the grid, at the same time renewables were being pushed in and on.
In conclusion, the true culprit behind both electricity and natural gas unaffordability, is “Minnesota’s requirement that one hundred percent of Minnesota’s energy to come from renewable sources such as wind and solar” and, therefore, the only real solution is “repealing.”
Source: Meeting Street Insights