In January, the unemployment rate in Minnesota (4.4%) was higher than that of the United States (4.3%) for the first time since November 2007.
Some of the local media reports ran thus:
KSTP: Minnesota job growth was flat during peak ICE surge, data shows
Minneapolis/St. Paul Business Journal: Minnesota unemployment hit five-year high during January ICE surge
KEYC: Minnesota Unemployment Rate Rises to 4.5% in February; ICE Presence Cited as Factor
In a report titled “What’s behind Minnesota’s bad January jobs report,” Axios quoted Department of Employment and Economic Development (DEED) commissioner Matt Varilek saying: “While we can’t say that there was one and only one factor, it seems entirely possible to me that the ICE actions influenced our January numbers in a very negative way.”
Is Minnesota’s above average unemployment rate for January really the result of Operation Metro Surge? It is hard to see that in the data.
Unemployment rates have been converging for two years
Figure 1 shows the unemployment rate for Minnesota minus the unemployment rate for the United States generally since Gov. Walz’ inauguration in January 2019. In January 2025, for example, the national unemployment rate was 4.0% and our state’s rate was 3.4% which shows up here as -0.6 percentage points; the lower the blue line the better is Minnesota’s performance relative to the United States generally.
Figure 1
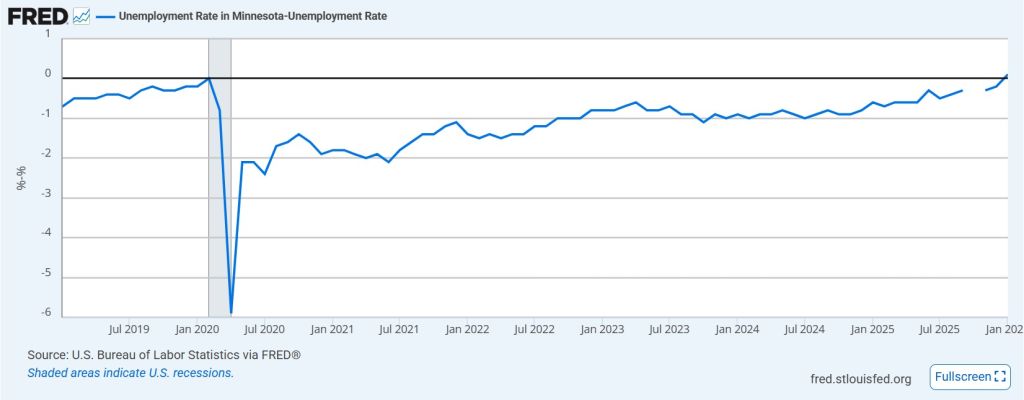
What we see is that Minnesota’s unemployment rate has been steadily drifting up towards the national rate since January 2024; then, Minnesota’s unemployment rate was 0.9 percentage points below that of the United States but, by the eve of Metro Surge in December 2025, that gap had closed to 0.2 percentage points. In short, with or without Metro Surge, on the trends of the last two years, Minnesota’s unemployment rate was bound to rise above average at some point soon.
Minnesota’s labor market has been deteriorating for a year
What is behind this relative deterioration of Minnesota’s labor market relative to the United States generally?
I noted long ago that “The unemployment rate is calculated by dividing the number of people who are unemployed but looking for work by the total number of people in the labor force:”

It follows that if the unemployment rate (the sum) has risen, that must be because the number of people who are unemployed but looking for work (the numerator) has risen by more than the total number of people in the labor force (the denominator). Indeed, that is exactly what Figure 2 shows using data from the Bureau of Labor Statistics (BLS). We see that since January 2024, the labor force in Minnesota has grown by just 2.1% but the number of unemployed has risen by 57.7%. Over the same period, the United States’ labor force growth is comparable, 1.9%, but its number of people unemployed has risen by 19.3%, a rate a little over one third that of Minnesota.
Figure 2: Growth of labor force and unemployed, January 2024=100
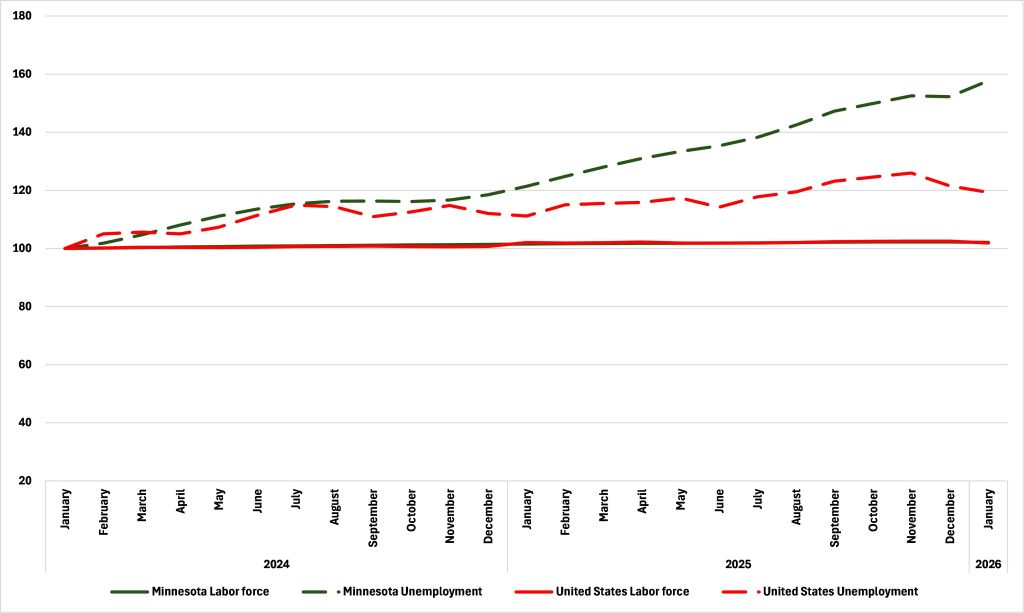
You might be asking yourself how the United States and Minnesota can have similar levels of labor force growth but such widely divergent levels of unemployment growth.
As I noted a very long time ago, “Those Minnesotans who are either employed or unemployed but looking for work are deemed to be in the labor force.” So, what do we see when we look at this second component of the labor force, those who are actually employed?
As Figure 3 shows, from January 2024 to January 2026, the number of people employed in Minnesota rose by 0.5% while, for the United States generally, the increase was more than double: 1.2%. Indeed, in December 2025, on the eve of Metro Surge, the number of people employed in Minnesota was 5,960 lower than it was in February 2025.
Figure 3: Growth of employed, January 2024=100
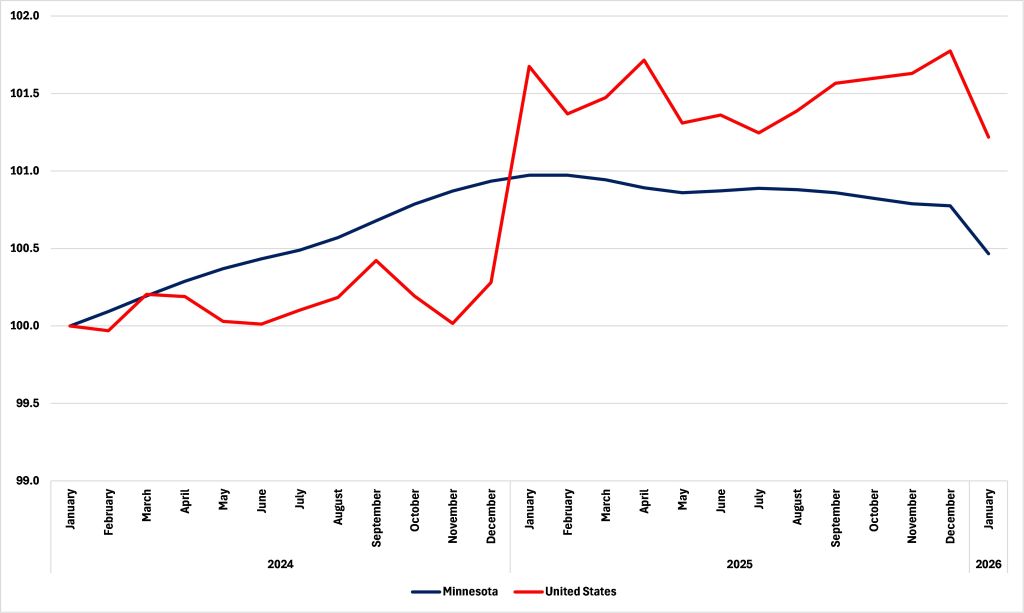
The marked decline in jobs in Minnesota from December 2025 to January 2026 has been much commented on and has been offered as evidence for Metro Surge’s impact. Two things suggest otherwise.
First, as I noted long ago, “The number of people employed comes from the Household survey which is conducted by the U.S. Census Bureau as part of its Current Population Survey (CPS). ” Are we to believe that this large number of people who quit work because of Metro Surge then dutifully filled out Federal government surveys when they landed on their mats?
Second, the United States also saw a sharp drop in the number of people employed from December 2025 to January 2026; down by 0.3% compared to 0.5% in Minnesota. This suggests some larger factor or factors at play. This would suggest that that decline was not due to the introduction of the Paid Family and Medical Leave (PFML) scheme, although that might well be a plausible part of the longer-term trend, like that decline in employment over 2025.
Minnesota’s labor market has been ailing for some time. While our labor force is growing at a rate comparable to the United States generally, we are not generating jobs at the same rate, with the result that our numbers of people unemployed and, hence, our unemployment rate is drifting up. Given these realities, Minnesota becoming a state with above average unemployment was bound to happen at some point.
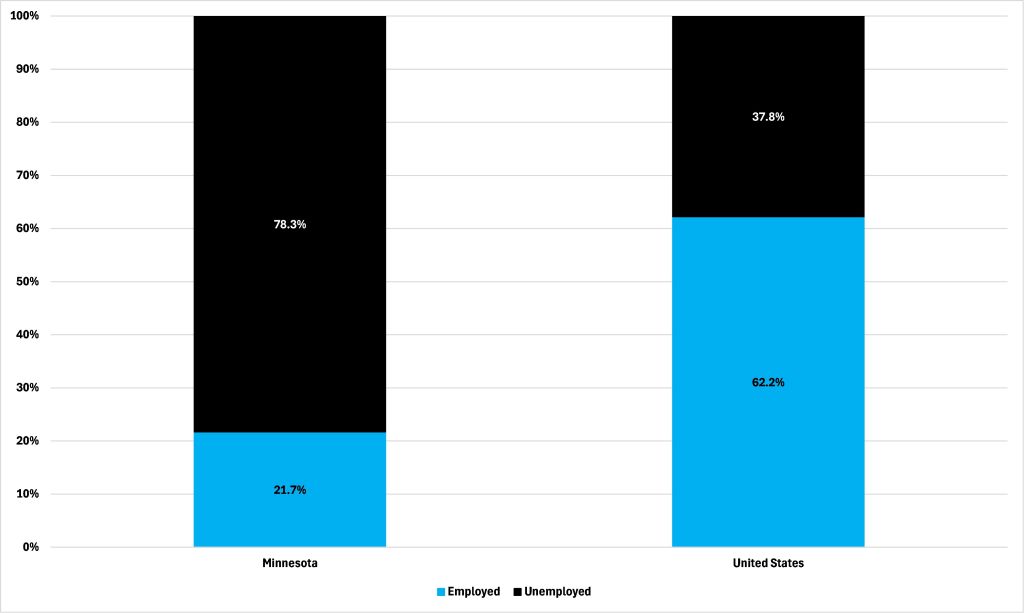
Figure 4 summarises, breaking down the growth in the labor force in both Minnesota and the United States between January 2024 and January 2026 into those who took employment and those who are unemployed. It shows that for the United States generally, 62.2% of those who entered the labor force between January 2024 and January 2026 did so to take a job; in Minnesota just 21.7% of entrants did, little better than one in five. This is a mounting crisis for our state, and cannot be blamed on Metro Surge.
Figure 4: Labor force growth by employment status, January 2024 to January 2026