
On Tuesday, I noted that for 2025, the average earner will pay more state income tax in Minnesota than in 43 other states and that our state is one of just 16 where the share of the average earner’s wages swallowed up by the state government in income tax has increased over the last decade.
The flip side of high taxes and increases in tax burdens is high and increased state government spending.
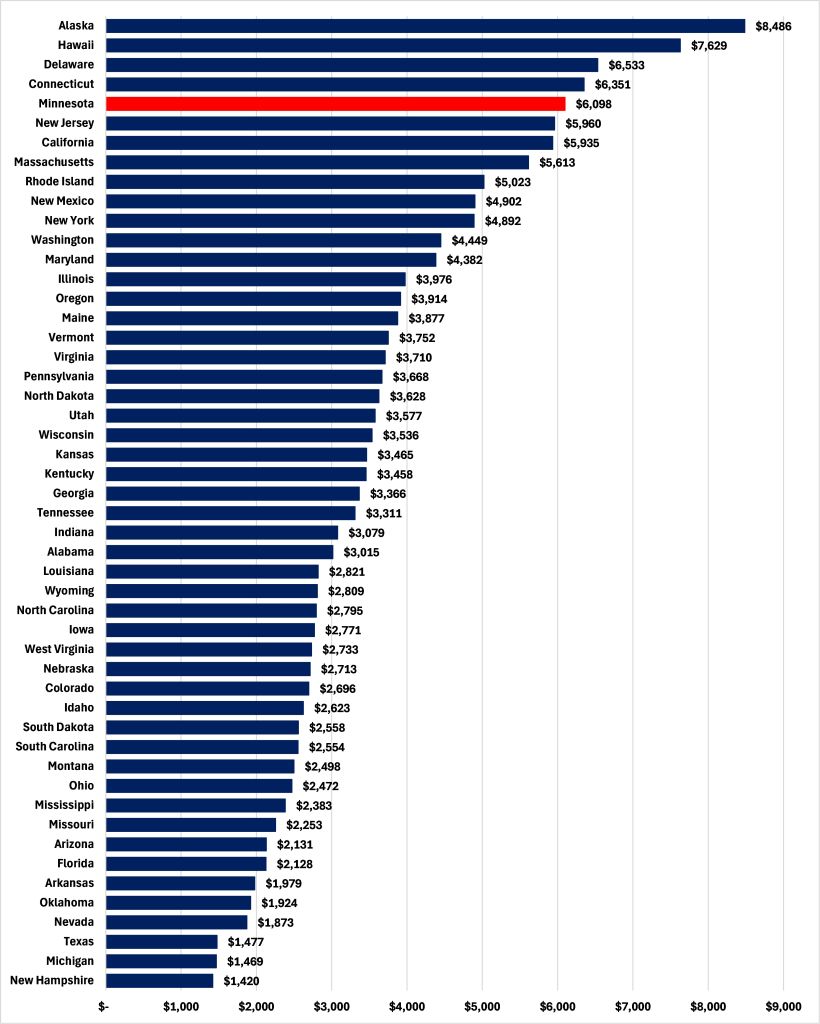
Using data on General Fund spending and population, we can calculate the per person amount of government spending in each state. As Figure 1 shows, in 2025, Minnesota’s state government spent $6,098 per person, an amount higher than in 45 other states.
Figure 1: Per capita General Fund spending, 2025
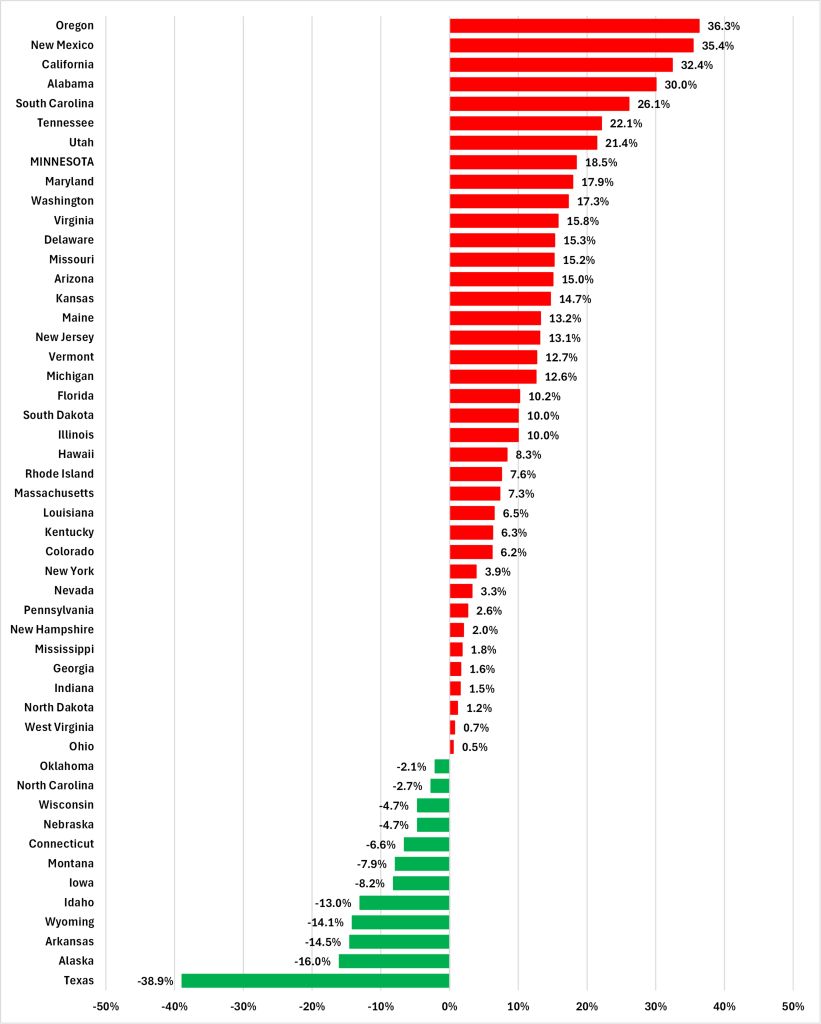
If we adjust for inflation, we can calculate the increase in per capita state government spending over time in real terms. As Figure 2 shows, adjusted for inflation, Minnesota’s level of state government spending per person increased by 18.5% between 2019 and 2025. This was a greater increase than in 42 other states; indeed, in 12 states government spending per person fell in inflation adjusted terms over the same period.
Figure 2: Real increase in per capita General Fund spending, 2019 to 2025
I left readers with a couple of questions on Tuesday and I will leave you with a couple more today; are you getting more out of your state government than the residents of those 45 lower spending states? Are you getting 18.5% more out of your state government than you were in 2019?