Per-capita analysis reveals surprising exposure in Virginia and Massachusetts, offering a fuller picture of how deeply federal dollars shape state economies
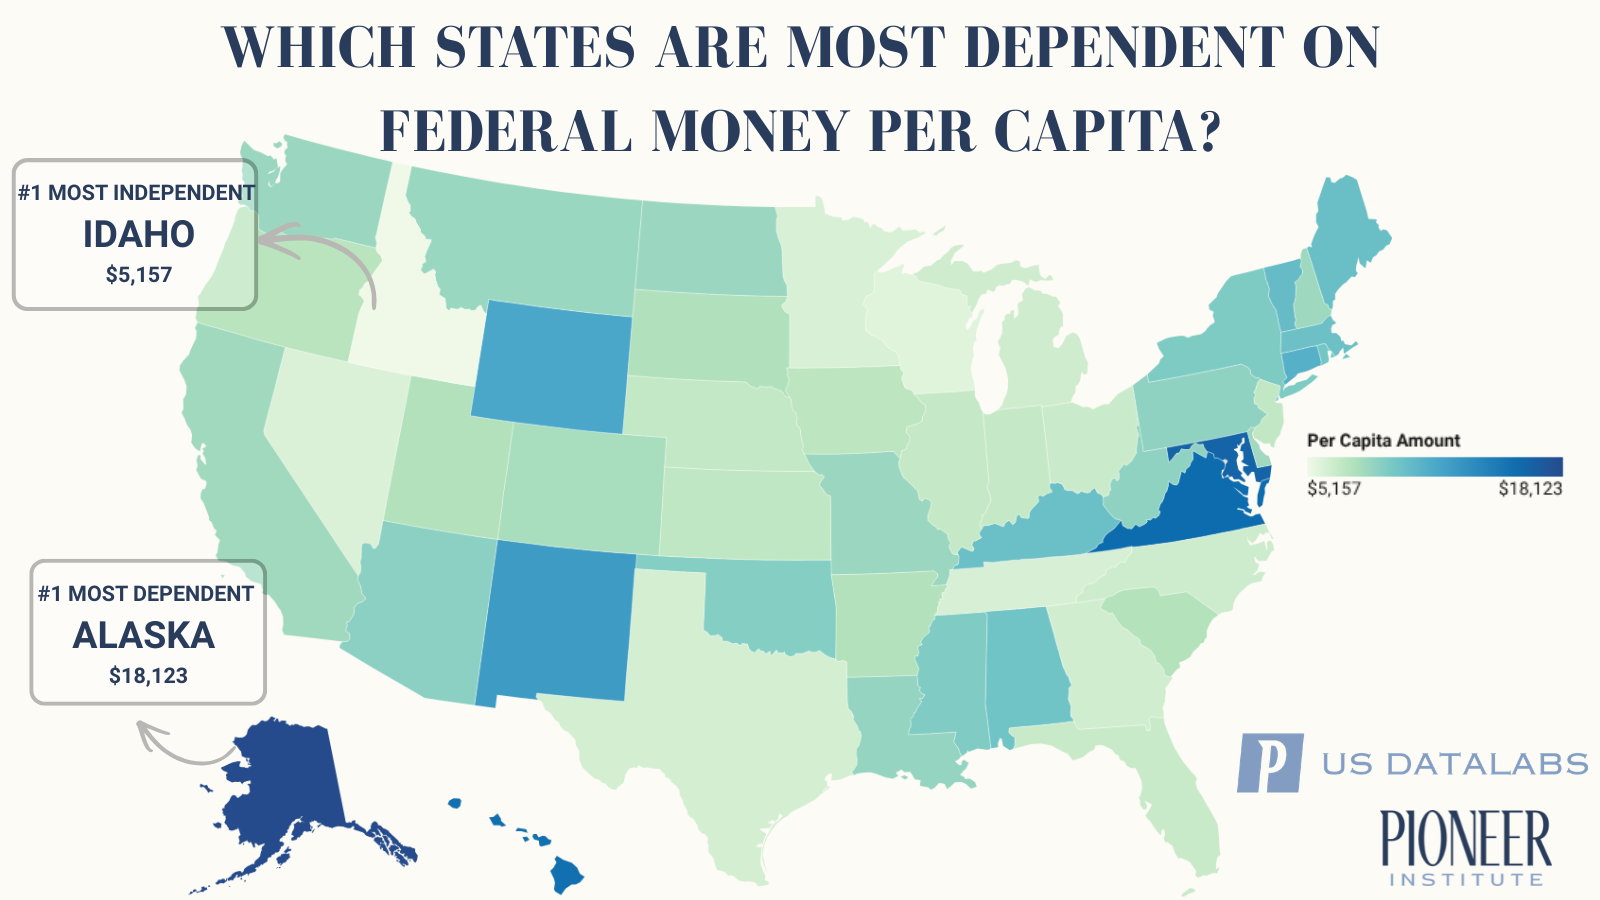
BOSTON – Pioneer Institute’s new “Dependency Index” finds that Alaska is the state most dependent on federal funds, followed by Maryland and Virginia, while Idaho, Wisconsin, and Nevada are the least dependent. The real surprise lies in the per-capita analysis, which places Virginia third and Massachusetts 11th by measuring how deeply federal dollars are embedded in each state’s economic life.
“This index takes a different approach by analyzing federal dollars on a per-capita basis and in relation to state income and spending,” said Pioneer Institute Executive Director Jim Stergios. “In doing so, it captures how deeply those dollars are embedded in the services, payrolls, and transfer systems that shape state budgets and local economies.”
The “Dependency Index – Federal Money to the States” is the first in a series of Pioneer indices designed to compare states against one another.
Most rankings measure only transfers. Pioneer instead measures how deeply federal dollars are embedded in the economic life of each state—its people, incomes, and household spending—producing a more realistic picture of dependency and a more credible comparison across states.
That fuller methodology produces some of the sharpest departures from conventional rankings. Virginia ranks as the third most dependent state, though some other indices place it in the 30s, while Massachusetts rises to 11th, far above the 40s where it has appeared elsewhere. Pioneer also finds that Maryland becomes the most dependent state when federal funding is measured against personal consumption, underscoring how different methodologies reveal different forms of economic exposure.
The analysis examines federal funding to state and local governments across key areas, including transportation, education, public health, housing, public welfare, natural resources, disaster assistance, economic development, and core infrastructure systems. It excludes funding streams that could result in double counting or that are categorized elsewhere.
In addition to Social Security payments, defense contracts, and intergovernmental transfers, which are typically included in these rankings, Pioneer’s Dependency Index also includes FEMA obligations, federal civilian employee payroll by state, and military payroll by state, categories that are not usually captured in similar comparisons. This gives a fuller picture of a state’s fiscal independence and economic strength.
“We strove to be as comprehensive as possible,” said Michael Walker, Senior Fellow for Policy Analytics. “If we could attach a federal dollar amount to it, we included it.”
Too many dependency rankings are shaped more by political arguments over “donor” and “recipient” states than by economic reality. By omitting major funding streams, many obscure more than they reveal.
“The federal budget has grown from just under $2 trillion to almost $7 trillion annually in just the last 25 years,” said Public Policy Analyst Liam Day, who worked with Walker to create the index. “As it has grown, much of that money has flowed into the states surrounding Washington, D.C., where so many federal civilian and military employees live. That helps explain why Maryland and Virginia emerge as among the most federally dependent state economies in the country.”
The spending categories tracked by the Dependency Index—including intergovernmental transfers such as Medicaid and income security programs, Medicare, Social Security, FEMA, and defense spending—represent more than 70 percent of the federal budget. Data were sourced directly from federal agencies rather than non-governmental organizations because the federal government has refined and documented these methodologies over many years of collection.
The per capita amount of federal dollars states receive annually ranges from $18,123 in Alaska to $5,157 in Idaho.
The ranking does not include Washington, D.C., because its dependency on the federal government is such an extreme outlier, especially when federal civilian and military payroll are included.
The rankings are sourced and assembled by USDataLabs.org, Pioneer’s online platform for public policy data and state-by-state comparisons. It aggregates statistics across nine core areas: Government, Economy, Education, Infrastructure, Population, Taxation, Energy, Health, and Crime & Justice. Pioneer anticipates releasing new rankings quarterly and updating them as new data become available.
“These rankings are designed to help states benchmark fiscal resilience, economic independence, and exposure to federal policy changes over time,” Stergios said.
###
FAQ: Why Pioneer’s Dependency Index Provides a Fuller Picture
Q: How is Pioneer’s methodology different?
Most rankings focus narrowly on grants, transfers, or tax return ratios. Pioneer measures federal dollars on a per-capita basis and against personal income and consumption, giving a fuller picture of how deeply federal spending shapes each state’s economy.
Q: Why is per capita stronger than raw dollar comparisons?
Raw totals naturally make larger states appear more dependent. A per-capita approach standardizes the comparison and better captures how reliant the average resident and state economy are on federal spending.
Q: Why measure against income and consumption?
Federal dollars affect more than budgets—they support wages, household spending, and local business activity. Scaling those flows against personal income and consumption better measures economic exposure if Washington priorities shift.
Q: What does Pioneer include that others often leave out?
In addition to Social Security, Medicare, Medicaid, defense contracts, and intergovernmental transfers, Pioneer includes federal civilian payroll, military payroll, and FEMA obligations—major spending streams that materially shape state economies.
Q: Why does that matter?
Leaving out payroll and other direct federal spending understates states with large federal workforces, military concentrations, disaster exposure, or research ecosystems. That is why Virginia, Maryland, and Massachusetts rank meaningfully higher here than in traditional comparisons.
Q: Why do some other rankings produce very different results?
Many are designed around the political question of which states “give more than they get back.” Pioneer instead measures how deeply federal dollars are embedded in jobs, services, payrolls, and household consumption.
Q: Why is this useful for policymakers?
It gives policymakers a clearer view of how exposed their budgets, labor markets, and household economies are to changes in federal spending. The goal is to benchmark fiscal resilience and long-term economic independence.