Last week I wrote about natural gas affordability with the aid of official data on prices and quantities from the US Energy Information Administration (EIA) and concluded:
“Natural gas prices have been inflating in the 21st century because it has had to increasingly carry the load (base and peak) for reliable electricity generation, whilst coal was being pushed out and off the grid, at the same time renewables were being pushed in and on.”
Now let’s examine this using the official data on consumer price index (CPI) from the US Bureau of Labor Statistics (BLS), as I previously did in June with electricity affordability.
CPI Context
Although CPI literally has the term “price index” in the full name, there is an element of quantity index as well. Quantity of goods and services that is. As the BLS describes it:
“CPI measures the average change in price over time of a market basket of consumer goods and services. It is based on the expenditure patterns of a sample of urban consumers representing over 90 percent of the population. The base period is when the time series of index values is normalized to 100.”
Fortunately, BLS also has decades of CPI data for electricity and natural gas specifically and respectively. Unfortunately, these are no longer compiled since 2025 for metropolitan areas, like Minneapolis St Paul (MSP), nor for regions, such as the Midwest (MW).
Twin Cities
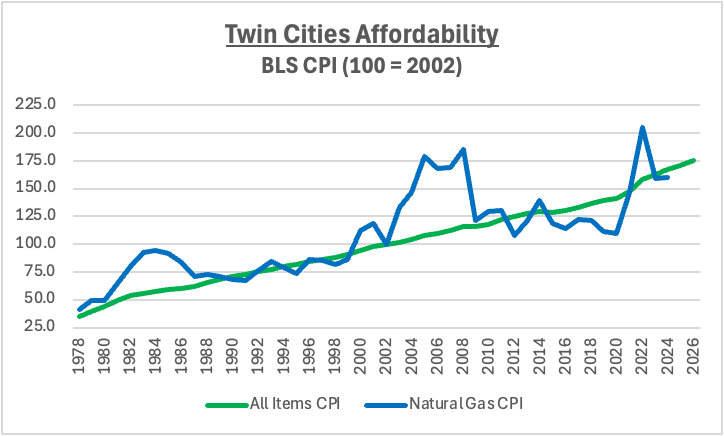
The first chart below of CPI, for the Twin Cities or MSP alone, contrasts natural gas CPI with all items CPI. Key trends include:
- natural gas CPI was relatively flat between 1986 and 1999, increasing only 4.2% from 83 index points to 87;
- natural gas CPI exploded by 65% from 112 in 2000 to 186 in 2008, then dropped and was 41% lower by 2020 at 110, but shot up again by 88% to 206 in 2022;
- overall from 2000 until 2024, although natural gas CPI had inflated 43% compared to all items CPI inflation of 76%, the former has a high volatility at a 28 standard deviation points compared to the medium volatility of the latter of 20 points.
Interstate Comparison
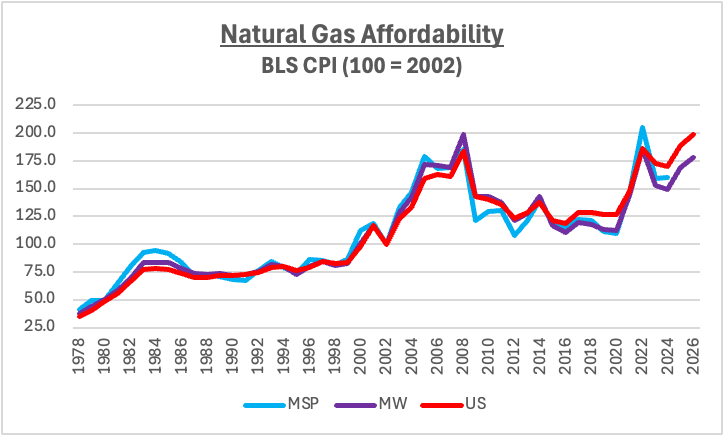
Natural gas CPI has largely been contiguous, in its trend as well as ups-and-downs from 1978 to 2024, when comparing MSP to both MW and US. The second chart below of natural gas CPI has five stand-out trend periods. Highlights from these, for MSP only, include:
- 1978 to 1984: inflation of 127%; and standard deviation or volatility of 22;
- 1985 to 1999: deflation of -6%; and volatility of 8;
- 2000 to 2008: inflation of 65%; and volatility of 31;
- 2009 to 2019: deflation of -8%; and volatility of 9;
- 2020 to 2024: inflation of 46%; and volatility of 34.
Affordability Volatility
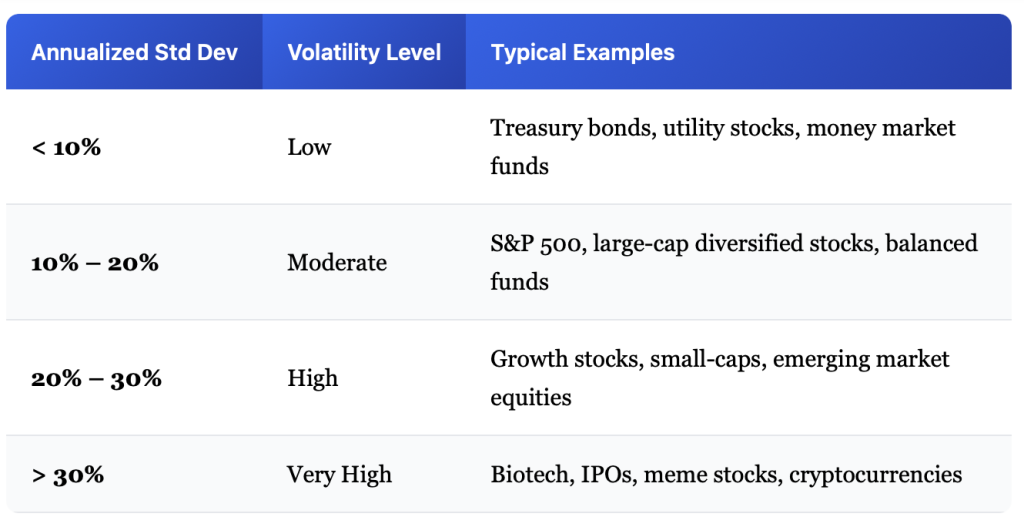
CPI measures changes in price and quantity, but not quality as such. Volatility, however, can also be gleaned from it. A few important things to know about volatility follow:
“Volatility is the most fundamental risk measure in [statistics]. Standard deviation (σ) measures the dispersion of [data] around their average (mean). A higher standard deviation means more volatility — wider swings in both directions.” – Ryan O’Connell
“If we lose 50% of our money, we cannot simply average our results across the multiverse of alternative selves who may not have lost theirs. The best we can do is try to average our results over time on our one, singular path. When you average over time, choices compound. And when choices compound, so does risk. The impact of compounding means that volatility matters.” – Return Stacked® Portfolio Solutions
” The prices of electricity and natural gas are subject to continuous fluctuations, a phenomenon known as energy pricing volatility. Beyond direct costs, volatility undermines financial planning for both households and businesses, creating budgetary uncertainty that can lead to stress for families and hinder long-term investment or growth—especially in energy-intensive sectors. Because energy is a fundamental input across various industries, including manufacturing, agriculture and retail, rising costs often ripple through the economy.” – Energy Business Review
Conclusion
Energy affordability has three major dimensions of price inflation, quantity or quality curtailment or deprivation, as well as volatility of these. In electricity, deprivation can take the form of blackouts. Electricity CPI in MN has been more about inflation than volatility, whereas natural gas CPI in MSP has been more volatile but with an inflationary trend upwards. Either way, both electricity and natural gas are significantly less affordable in the 21st century.
Source: Ryan O’Connell, CFA