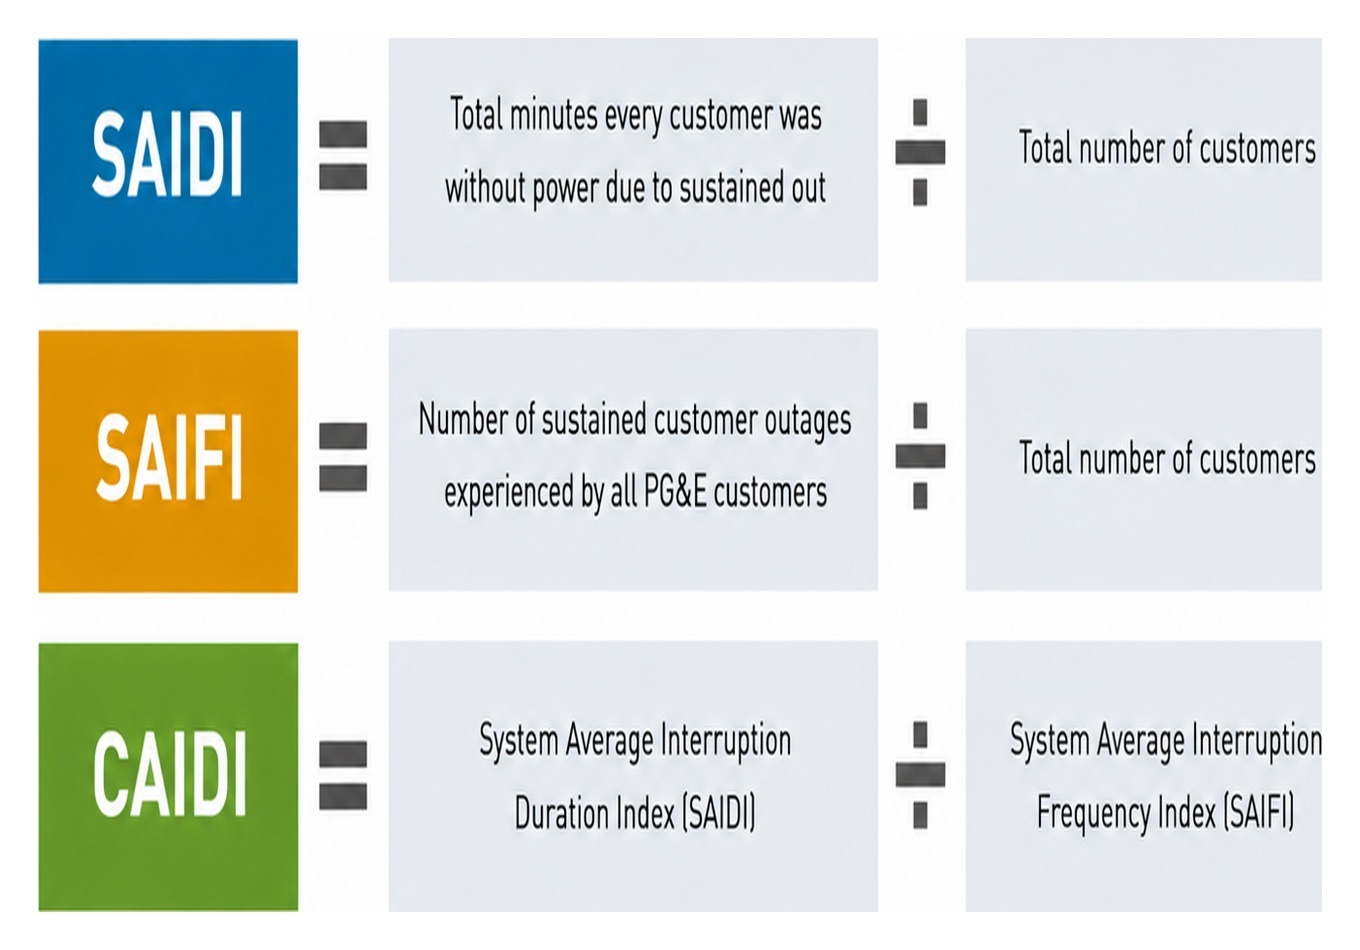
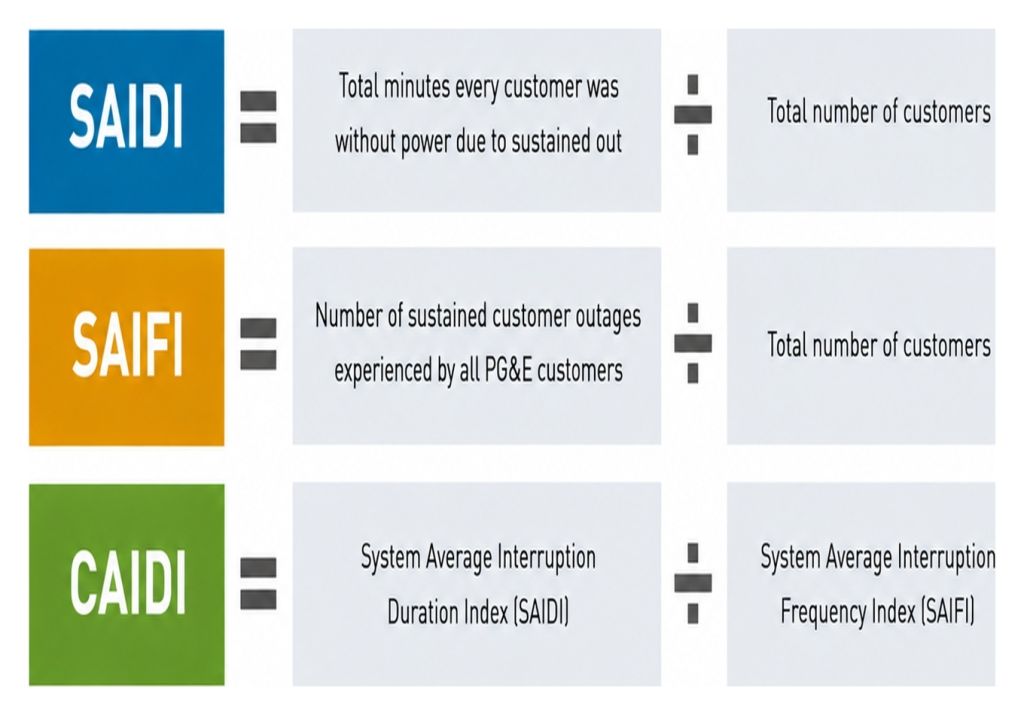
The Big 3 measures for electricity reliability in Minnesota (MN), as well as around the country and world, are SAIFI, SAIDI and CAIDI. The MN Public Utilities Commission (PUC) defines these as follows:
- System Average Interruption Frequency Index (SAIFI) measures the average number of disruptions for a customer in a year.
- System Average Interruption Duration Index (SAIDI) measures the annual average outage duration for each customer served in hours.
- Customer Average Interruption Duration Index (CAIDI) measures the average outage duration (or conversely, restoration time) for a given customer.
The Energy Information Administration (EIA) has SAIFI, SAIDI and CAIDI data for the US as a whole and for every state including MN. Unfortunately, unlike say their pricing data, these reliability measures only go back to 2014. Ideally, these would go back to the 1980s or 1970s.
MN electricity reliability
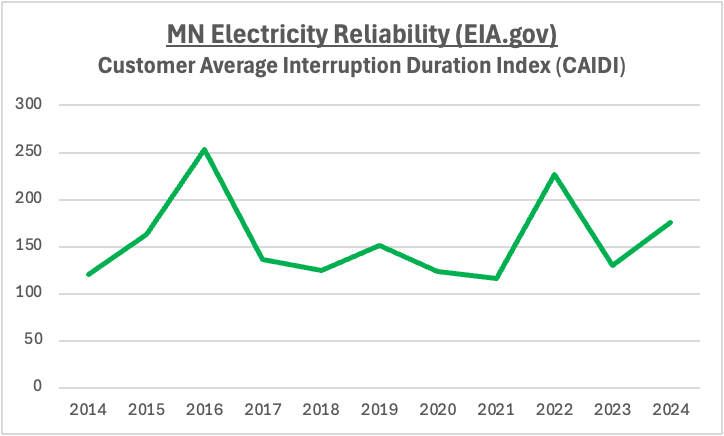
Minnesota electricity reliability has been an up-and-down mixed bag between 2014 and 2024 as can be seen in the three charts below on SAIFI, SAIDI and CAIDI. Note that bigger numbers for these three measures are bad, smaller numbers are good, and zero is perfect. This is also the case when it comes to change (2024 less 2014), spread (maximum less minimum) and volatility (relative standard deviation).
The following statistics paint a much bleaker picture for MN reliability than the charts do. MN’s SAIDI and CAIDI spreads and volatility are particularly bad.
- Chart 1: SAIFI change was 25%, spread was 32% and volatility was 11%.
- Chart 2: SAIDI change was 82%, spread was 152% and volatility was 51%.
- Chart 3: CAIDI change was 46%, spread was 118% and volatility was 33%.
Chart 1
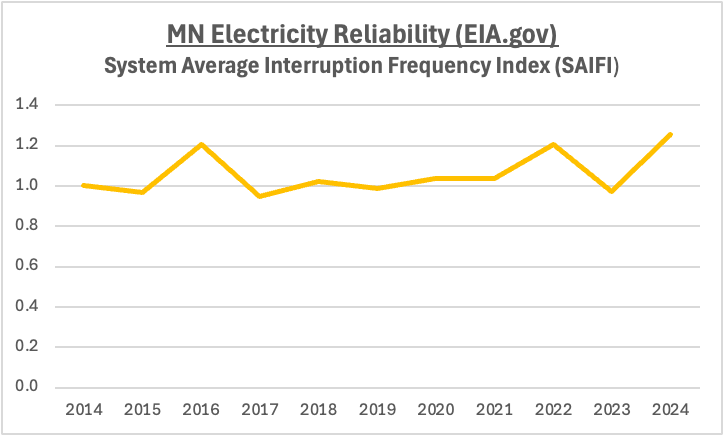
Chart 2
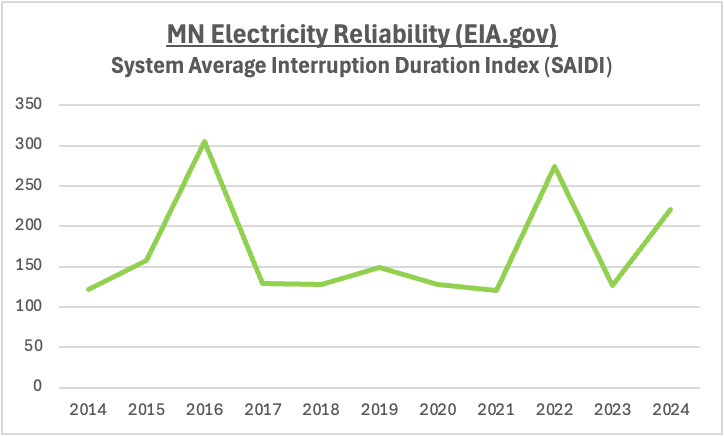
Chart 3
US electricity reliability
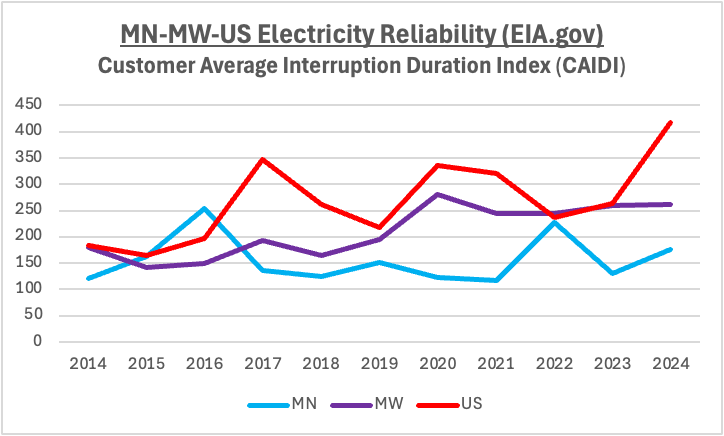
Electricity unreliability, as measured by SAIFI, SAIDI and CAIDI in the three charts below, has been relatively flat or decreasing for the Midwest (MW) but on the rise for MN and the US.
Yet the following statistics paint an even bleaker picture for MN reliability than the charts do. MN performs worse than both MW and US on SAIFI. MN is worse than MW, but better than US, on SAIDI and CAIDI. Although, MN is the worst on volatility for all three.
- Chart 4: SAIFI change was 25% for MN compared to -3% for MW and 23% for US.
- ——————-spread was 32% for MN compared to 18% for MW and 23% for US.
- ——————-volatility was 11% for MN compared to 4% for MW and 6% for US.
- Chart 5: SAIDI change was 82% for MN compared to 51% for MW and 180% for US.
- ——————-spread was 152% for MN compared to 113% for MW and 208% for US.
- ——————-volatility was 51% for MN compared to 26% for MW and 38% for US.
- Chart 6: CAIDI change was 46% for MN compared to 45% for MW and 128% for US.
- ——————-spread was 118% for MN compared to 99% for MW and 154% for US.
- ——————-volatility was 33% for MN compared to 25% for MW and 30% for US.
Chart 4
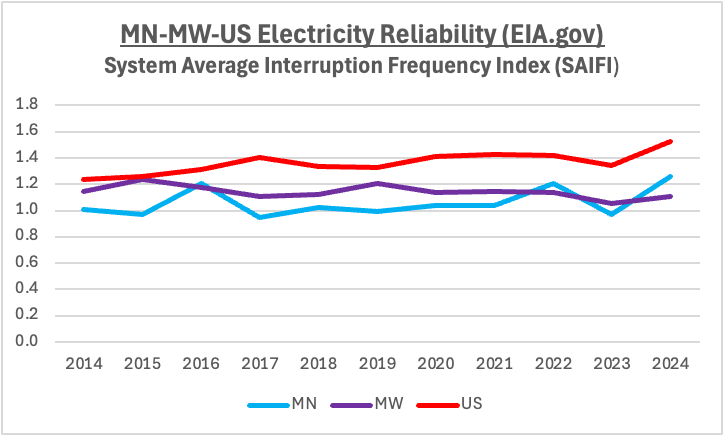
Chart 5
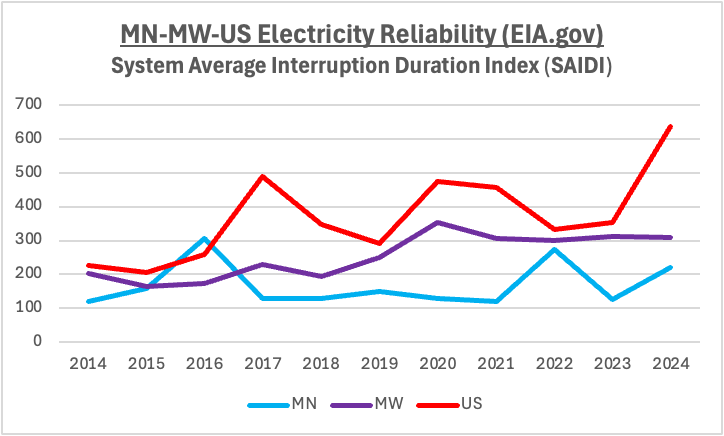
Chart 6
MN electricity generation
Electricity reliability has been bad in Minnesota from 2014 to 2024, especially compared to the rest of the Midwest. It probably has increasingly been so from 2004 onwards, but the data for SAIFI, SAIDI and CAIDI does not go that far back, much less further back to say 1978.
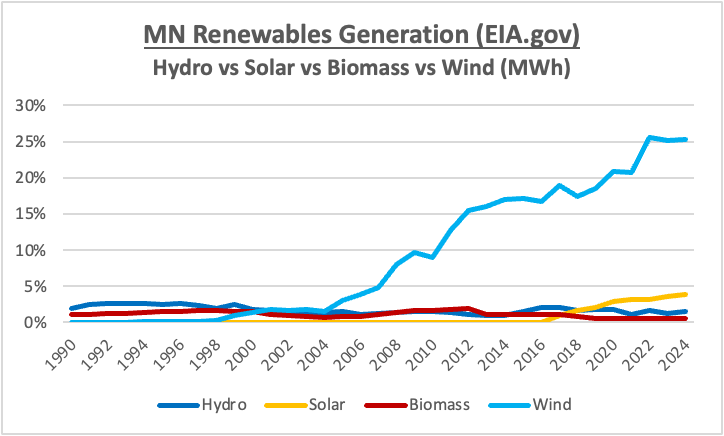
Minnesota’s electricity reliability has worsened due to the meteoric rise in renewables generation, especially that of wind, and to a much lesser degree solar. However, this has been mitigated to some extent by the almost parallel rise in natural gas generation. Some key statistics in this regard follow next.
- Chart 7: MN’s electricity generation mix of both renewables and natural gas grew from 3% each in 2004 to 31% and 27% respectively by 2024, whilst coal and nuclear both shrunk from 65% and 25% respectively in 2004 to 20% each by 2024.
- Chart 8: MN’s renewables generation mix of wind grew from 2% in 2004 to 25% by 2024 and solar grew from 1% in 2017 to 4% by 2024, whilst both hydro and biomass stayed relatively flat from 2004 to 2024 at less than 2% and 1% respectively.
Chart 7
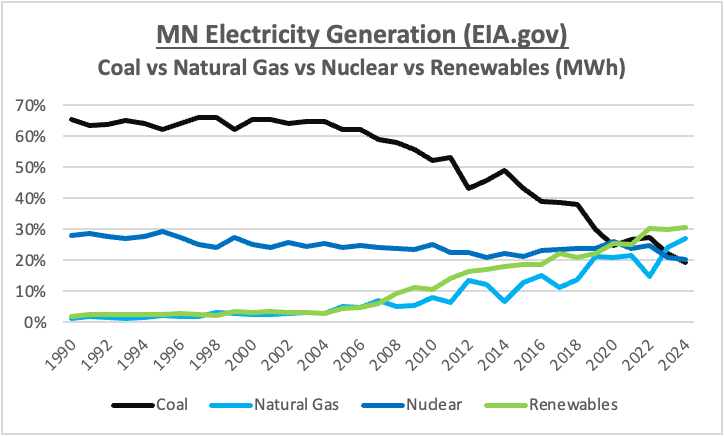
Chart 8
Conclusion
Official statistics show that Minnesota, not only has an increasing electricity affordability problem since 2002, especially compared to the rest of the Midwest, but that MN also has a rising electricity reliability issue since 2014, again especially compared to the rest of the MW. This is “two [effects] for the price of one [cause]” i.e. unaffordable and unreliable renewables.
Source: PG&E Electric reliability reports November 24, 2025